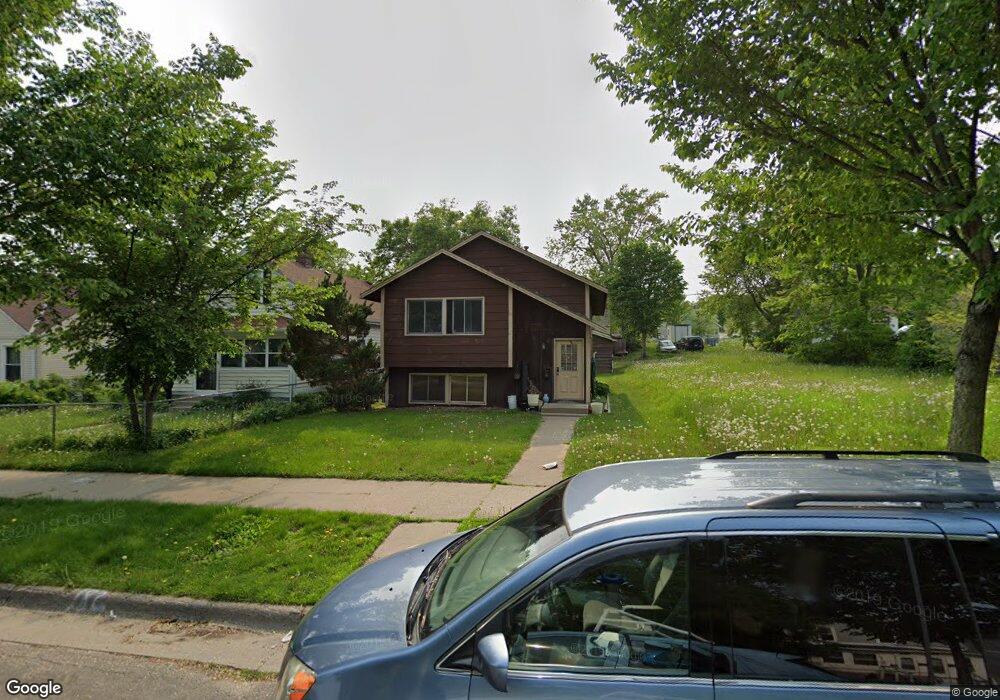
2023 Russell Ave N Minneapolis, MN 55411
Willard-Hay NeighborhoodEstimated Value: $198,000 - $280,000
3
Beds
2
Baths
879
Sq Ft
$266/Sq Ft
Est. Value
About This Home
This home is located at 2023 Russell Ave N, Minneapolis, MN 55411 and is currently estimated at $233,618, approximately $265 per square foot. 2023 Russell Ave N is a home located in Hennepin County with nearby schools including Bryn Mawr Elementary School, Anwatin Middle School, and North High School.
Ownership History
Date
Name
Owned For
Owner Type
Purchase Details
Closed on
Nov 25, 2024
Sold by
Yan Kao and Yang Kao
Bought by
Jennings Xia Vue
Current Estimated Value
Home Financials for this Owner
Home Financials are based on the most recent Mortgage that was taken out on this home.
Original Mortgage
$116,000
Outstanding Balance
$111,071
Interest Rate
6.44%
Mortgage Type
New Conventional
Estimated Equity
$122,547
Purchase Details
Closed on
Aug 24, 2016
Sold by
Vue Cindy
Bought by
Vue Jennings Xia
Purchase Details
Closed on
May 29, 2013
Sold by
Yang Kao and Vue Vang Her
Bought by
Vue Cindy
Purchase Details
Closed on
Jan 24, 2011
Sold by
Deutsche Bank National Trust Company
Bought by
Yan Kao and Vue Vang Her
Purchase Details
Closed on
Oct 2, 2010
Sold by
Smith Sharon K
Bought by
Deutsche Bank Natl Trust Company
Create a Home Valuation Report for This Property
The Home Valuation Report is an in-depth analysis detailing your home's value as well as a comparison with similar homes in the area
Home Values in the Area
Average Home Value in this Area
Purchase History
| Date | Buyer | Sale Price | Title Company |
|---|---|---|---|
| Jennings Xia Vue | $500 | Executive Title | |
| Vue Jennings Xia | -- | None Available | |
| Vue Cindy | -- | None Available | |
| Yan Kao | $36,000 | None Available | |
| Kao Yan | $36,000 | -- | |
| Deutsche Bank Natl Trust Company | $2,000 | -- |
Source: Public Records
Mortgage History
| Date | Status | Borrower | Loan Amount |
|---|---|---|---|
| Open | Jennings Xia Vue | $116,000 |
Source: Public Records
Tax History Compared to Growth
Tax History
| Year | Tax Paid | Tax Assessment Tax Assessment Total Assessment is a certain percentage of the fair market value that is determined by local assessors to be the total taxable value of land and additions on the property. | Land | Improvement |
|---|---|---|---|---|
| 2024 | $2,290 | $182,000 | $16,000 | $166,000 |
| 2023 | $2,094 | $180,000 | $16,000 | $164,000 |
| 2022 | $1,670 | $164,000 | $16,000 | $148,000 |
| 2021 | $1,273 | $143,000 | $10,000 | $133,000 |
| 2020 | $1,210 | $119,000 | $13,500 | $105,500 |
| 2019 | $1,171 | $108,000 | $9,000 | $99,000 |
| 2018 | $1,106 | $103,000 | $9,000 | $94,000 |
| 2017 | $1,081 | $95,500 | $8,200 | $87,300 |
| 2016 | $1,118 | $95,500 | $8,200 | $87,300 |
| 2015 | $1,084 | $90,500 | $8,200 | $82,300 |
| 2014 | -- | $90,500 | $8,200 | $82,300 |
Source: Public Records
Map
Nearby Homes
- 2007 Queen Ave N
- 2114 Sheridan Ave N
- 2123 Sheridan Ave N
- 2604 Golden Valley Rd
- 1722 Queen Ave N
- 2304 N Sheridan Ave
- 2119 Oliver Ave N
- 1800 Penn Ave N
- 1942 Oliver Ave N
- 1642 Thomas Ave N
- 1819 Newton Ave N
- 2349 Ferrant Place
- 2316 24th Ave N
- 1519 Oliver Ave N
- 1623 Morgan Ave N
- 1423 Penn Ave N
- 1933 Hillside Ave N
- 1815 Hillside Ave N
- 1423 Upton Ave N
- 1400 Queen Ave N
- 2027 Russell Ave N
- 2019 Russell Ave N
- 2031 Russell Ave N
- 2015 Russell Ave N
- 2011 Russell Ave N
- 2022 Sheridan Ave N
- 2018 Sheridan Ave N
- 2026 Sheridan Ave N
- 2007 Russell Ave N
- 2014 Sheridan Ave N
- 2030 Sheridan Ave N
- 2101 Russell Ave N
- 2010 Sheridan Ave N
- 2022 Russell Ave N
- 2026 Russell Ave N
- 2018 Russell Ave N
- 2003 Russell Ave N
- 2030 Russell Ave N
- 2014 Russell Ave N
- 2006 Sheridan Ave N