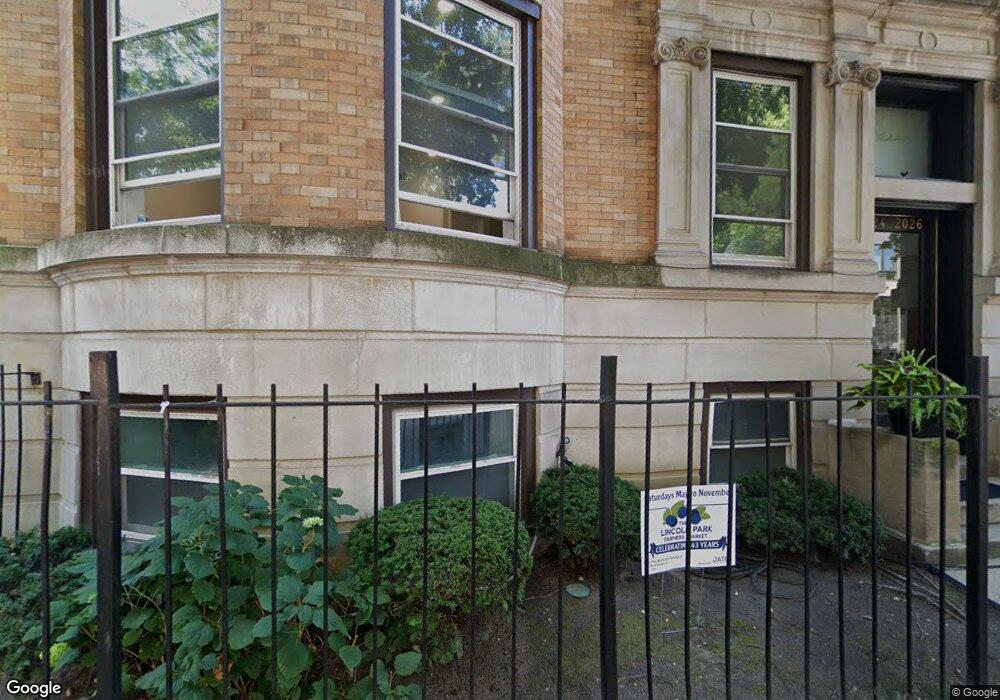
2024 N Howe St Unit 20243 Chicago, IL 60614
Lincoln Park NeighborhoodEstimated Value: $547,000
--
Bed
--
Bath
--
Sq Ft
6,229
Sq Ft Lot
About This Home
This home is located at 2024 N Howe St Unit 20243, Chicago, IL 60614 and is currently priced at $547,000. 2024 N Howe St Unit 20243 is a home located in Cook County with nearby schools including Abraham Lincoln Elementary School, Lincoln Park High School, and St. James Lutheran School.
Ownership History
Date
Name
Owned For
Owner Type
Purchase Details
Closed on
Mar 28, 2003
Sold by
Dye Charles and Dye Angela
Bought by
Silver Susan A
Current Estimated Value
Home Financials for this Owner
Home Financials are based on the most recent Mortgage that was taken out on this home.
Original Mortgage
$284,000
Outstanding Balance
$122,990
Interest Rate
5.86%
Mortgage Type
Unknown
Purchase Details
Closed on
Oct 29, 1997
Sold by
Griffin Michael N and Griffin Ellen
Bought by
Dye Charles
Home Financials for this Owner
Home Financials are based on the most recent Mortgage that was taken out on this home.
Original Mortgage
$150,000
Interest Rate
7.25%
Purchase Details
Closed on
Apr 20, 1995
Sold by
Stone Susan Ann
Bought by
Griffin Michael N and Griffin Ellen
Home Financials for this Owner
Home Financials are based on the most recent Mortgage that was taken out on this home.
Original Mortgage
$188,100
Interest Rate
7.87%
Create a Home Valuation Report for This Property
The Home Valuation Report is an in-depth analysis detailing your home's value as well as a comparison with similar homes in the area
Home Values in the Area
Average Home Value in this Area
Purchase History
| Date | Buyer | Sale Price | Title Company |
|---|---|---|---|
| Silver Susan A | $356,000 | Multiple | |
| Silver Susan A | $356,000 | Multiple | |
| Dye Charles | $239,000 | -- | |
| Griffin Michael N | $198,000 | -- |
Source: Public Records
Mortgage History
| Date | Status | Borrower | Loan Amount |
|---|---|---|---|
| Open | Silver Susan A | $284,000 | |
| Closed | Silver Susan A | $284,000 | |
| Previous Owner | Dye Charles | $150,000 | |
| Previous Owner | Griffin Michael N | $188,100 |
Source: Public Records
Tax History Compared to Growth
Tax History
| Year | Tax Paid | Tax Assessment Tax Assessment Total Assessment is a certain percentage of the fair market value that is determined by local assessors to be the total taxable value of land and additions on the property. | Land | Improvement |
|---|---|---|---|---|
| 2021 | $9,009 | $48,129 | $13,007 | $35,122 |
| 2020 | $10,031 | $48,130 | $11,446 | $36,684 |
| 2019 | $14,180 | $74,005 | $11,446 | $62,559 |
| 2018 | $13,940 | $74,005 | $11,446 | $62,559 |
| 2017 | $11,212 | $55,458 | $9,365 | $46,093 |
| 2016 | $10,607 | $55,458 | $9,365 | $46,093 |
| 2015 | $11,548 | $63,021 | $9,365 | $53,656 |
| 2014 | $7,743 | $41,730 | $7,024 | $34,706 |
| 2013 | $7,590 | $41,730 | $7,024 | $34,706 |
Source: Public Records
Map
Nearby Homes
- 1964 N Burling St
- 1878 N Orchard St
- 1913 N Halsted St Unit 1
- 1926 N Halsted St
- 1865 N Burling St
- 1849 N Mohawk St Unit 2
- 1853 N Burling St
- 2208 N Burling St
- 540 W Webster Ave Unit 311
- 551 W Grant Place
- 2040 N Sedgwick St Unit H
- 531 W Grant Place
- 1851 N Halsted St Unit 2
- 1862 N Halsted St Unit 3N
- 545 W Grant Place
- 1942 N Sedgwick St Unit PH
- 2007 N Sedgwick St Unit 202
- 648 W Belden Ave Unit B
- 2144 N Fremont St
- 505 W Menomonee St
- 2024 N Howe St Unit 20241
- 2024 N Howe St Unit 20242
- 2024 N Howe St Unit 1
- 2022 N Howe St
- 2022 N Howe St
- 2026 N Howe St Unit 1
- 2026 N Howe St Unit 20261
- 2026 N Howe St Unit 20263
- 2026 N Howe St Unit 20262
- 2026 N Howe St Unit 3N
- 2026 N Howe St Unit 2N
- 2020 N Howe St Unit 3N
- 2020 N Howe St Unit 2N
- 2020 N Howe St Unit 2S
- 2020 N Howe St Unit 1N
- 2020 N Howe St Unit 1S
- 2016 N Howe St Unit 3N
- 2016 N Howe St Unit 3S
- 2016 N Howe St Unit 2S
- 2016 N Howe St Unit 1S