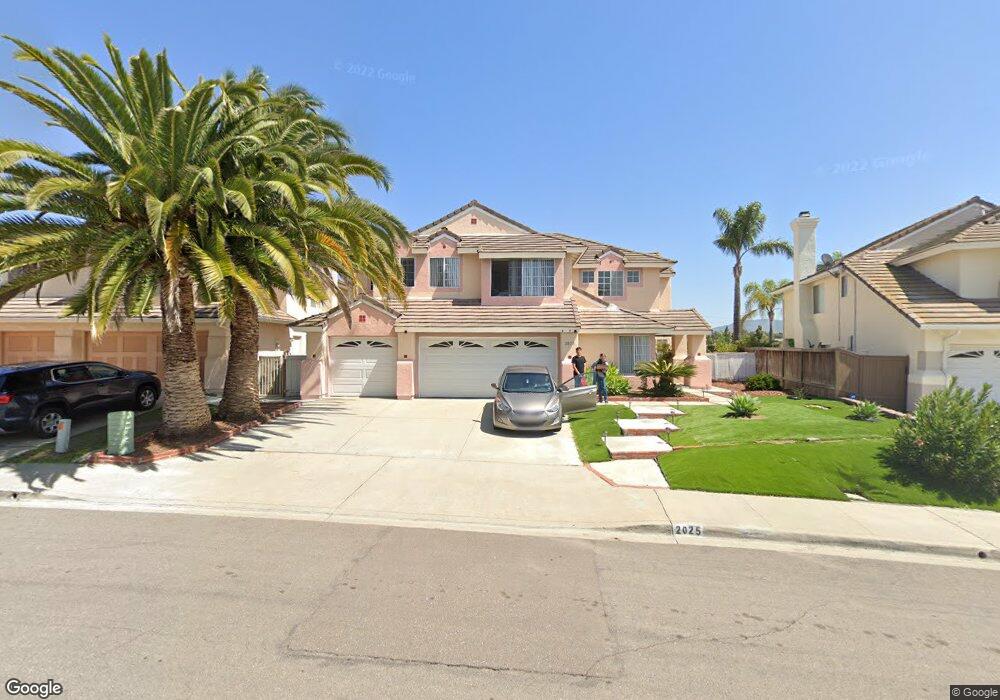
2025 Port Cardiff Chula Vista, CA 91913
Eastlake NeighborhoodEstimated Value: $1,091,130 - $1,191,000
4
Beds
3
Baths
2,579
Sq Ft
$440/Sq Ft
Est. Value
About This Home
This home is located at 2025 Port Cardiff, Chula Vista, CA 91913 and is currently estimated at $1,134,033, approximately $439 per square foot. 2025 Port Cardiff is a home located in San Diego County with nearby schools including Eastlake Elementary School, Bonita Vista Middle School, and Bonita Vista Senior High School.
Ownership History
Date
Name
Owned For
Owner Type
Purchase Details
Closed on
Feb 11, 2003
Sold by
Castillo Epifanio and Castillo Maria E
Bought by
Castillo Epifanio C and Castillo Maria E
Current Estimated Value
Home Financials for this Owner
Home Financials are based on the most recent Mortgage that was taken out on this home.
Original Mortgage
$300,700
Interest Rate
5.33%
Purchase Details
Closed on
Jul 19, 2001
Sold by
Castillo Epifanio C and Castillo Maria E
Bought by
Castillo Epifanio C and Castillo Maria E
Purchase Details
Closed on
Dec 30, 1996
Sold by
Serrano Thomas J and Serrano Anna L
Bought by
Household Bank Fsb
Purchase Details
Closed on
May 12, 1992
Sold by
Household Bank Fsb
Bought by
Castillo Epifanio and Castillo Emma
Home Financials for this Owner
Home Financials are based on the most recent Mortgage that was taken out on this home.
Original Mortgage
$65,900
Interest Rate
7.47%
Purchase Details
Closed on
Nov 12, 1986
Create a Home Valuation Report for This Property
The Home Valuation Report is an in-depth analysis detailing your home's value as well as a comparison with similar homes in the area
Home Values in the Area
Average Home Value in this Area
Purchase History
| Date | Buyer | Sale Price | Title Company |
|---|---|---|---|
| Castillo Epifanio C | -- | Lawyers Title Company | |
| Castillo Epifanio C | -- | -- | |
| Household Bank Fsb | $289,756 | Fidelity National Title | |
| Castillo Epifanio | $231,000 | Benefit Land Title Company | |
| -- | $207,300 | -- |
Source: Public Records
Mortgage History
| Date | Status | Borrower | Loan Amount |
|---|---|---|---|
| Closed | Castillo Epifanio C | $300,700 | |
| Previous Owner | Castillo Epifanio | $65,900 |
Source: Public Records
Tax History Compared to Growth
Tax History
| Year | Tax Paid | Tax Assessment Tax Assessment Total Assessment is a certain percentage of the fair market value that is determined by local assessors to be the total taxable value of land and additions on the property. | Land | Improvement |
|---|---|---|---|---|
| 2025 | $4,227 | $368,667 | $105,326 | $263,341 |
| 2024 | $4,227 | $361,439 | $103,261 | $258,178 |
| 2023 | $4,157 | $354,353 | $101,237 | $253,116 |
| 2022 | $4,038 | $347,405 | $99,252 | $248,153 |
| 2021 | $3,939 | $340,594 | $97,306 | $243,288 |
| 2020 | $3,844 | $337,103 | $96,309 | $240,794 |
| 2019 | $3,742 | $330,494 | $94,421 | $236,073 |
| 2018 | $3,682 | $324,015 | $92,570 | $231,445 |
| 2017 | $11 | $317,662 | $90,755 | $226,907 |
| 2016 | $3,514 | $311,434 | $88,976 | $222,458 |
| 2015 | $3,462 | $306,757 | $87,640 | $219,117 |
| 2014 | $3,401 | $300,749 | $85,924 | $214,825 |
Source: Public Records
Map
Nearby Homes
- 2100 Northshore Dr Unit A
- 2018 Bridgeport
- 2180 Hamden Dr
- 1950 Rue Michelle
- 707 Eastshore Terrace Unit 26
- 2151 Northshore Dr
- 725 Brookstone Rd Unit 101
- 732 Eastshore Terrace Unit 77
- 742 Eastshore Terrace Unit 98
- 746 Eastshore Terrace Unit 108
- 2015 Lakeridge Cir Unit 301
- 749 Brookstone Rd Unit 101
- 731 Brookstone Rd Unit 103
- 750 Eastshore Terrace Unit 120
- 773 Brookstone Rd Unit 304
- 761 Brookstone Rd Unit 203
- 753 Eastshore Terrace Unit 127
- 774 Eastshore Terrace Unit 169
- 2170 Lago Ventana
- 757 Eastshore Terrace Unit 210
- 2023 Port Cardiff
- 2027 Port Cardiff
- 2021 Port Cardiff
- 2029 Port Cardiff
- 2025 Chardonnay Terrace
- 2026 Port Cardiff
- 2022 Port Cardiff
- 2019 Port Cardiff
- 2031 Port Cardiff
- 2030 Port Cardiff
- 2018 Port Cardiff
- 2017 Port Cardiff
- 2023 Chardonnay Terrace
- 2033 Port Cardiff
- 2034 Port Cardiff
- 613 Port Stirling
- 2015 Port Cardiff
- 2014 Port Cardiff
- 2035 Port Cardiff
- 2038 Port Cardiff