2026 9th St Unit 2026 Berkeley, CA 94710
West Berkeley NeighborhoodEstimated Value: $869,000 - $1,210,000
3
Beds
2
Baths
1,528
Sq Ft
$697/Sq Ft
Est. Value
About This Home
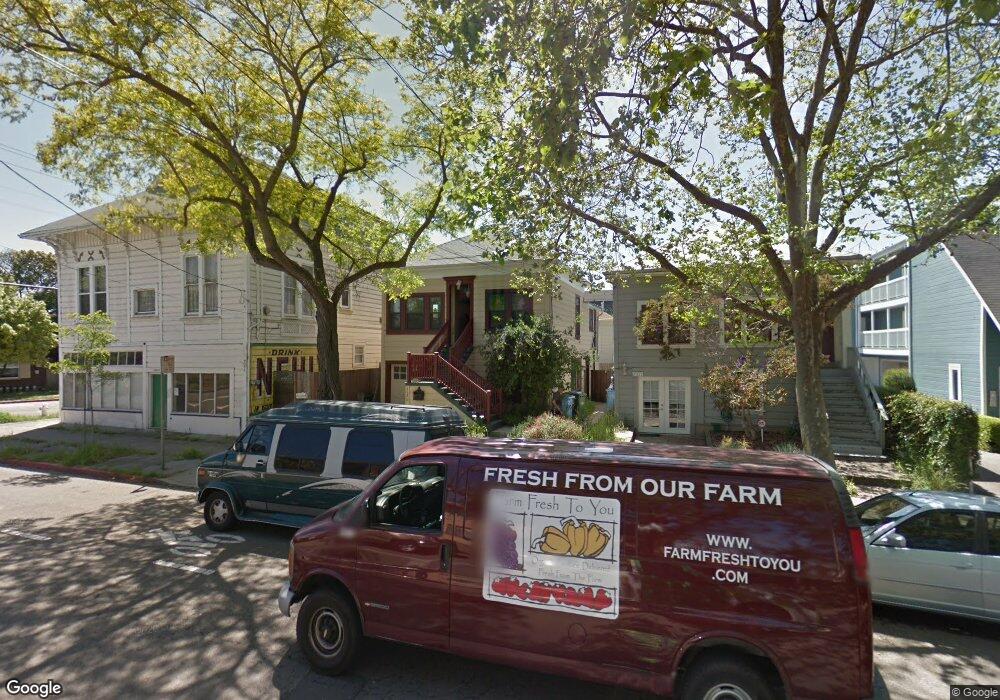
This home is located at 2026 9th St Unit 2026, Berkeley, CA 94710 and is currently estimated at $1,065,487, approximately $697 per square foot. 2026 9th St Unit 2026 is a home located in Alameda County with nearby schools including Rosa Parks Elementary School, Ruth Acty Elementary, and Berkeley Arts Magnet at Whittier School.
Ownership History
Date
Name
Owned For
Owner Type
Purchase Details
Closed on
Aug 23, 2021
Sold by
Schlosberg Mark A and Wong Jennifer Li
Bought by
Schlosberg Mark A and Wong Jennifer Li
Current Estimated Value
Home Financials for this Owner
Home Financials are based on the most recent Mortgage that was taken out on this home.
Original Mortgage
$441,500
Outstanding Balance
$370,241
Interest Rate
2.8%
Mortgage Type
New Conventional
Estimated Equity
$695,246
Purchase Details
Closed on
Aug 23, 2013
Sold by
Schlosberg Mark A and Wong Jennifer L
Bought by
Schlosberg Mark A and Wong Jennifer L
Purchase Details
Closed on
Feb 23, 2007
Sold by
Walker Ryan
Bought by
Schlosberg Mark A and Wong Jennifer L
Home Financials for this Owner
Home Financials are based on the most recent Mortgage that was taken out on this home.
Original Mortgage
$540,000
Interest Rate
6.23%
Mortgage Type
Purchase Money Mortgage
Purchase Details
Closed on
Mar 18, 1999
Sold by
Markell Carol A
Bought by
Walker Ryan
Create a Home Valuation Report for This Property
The Home Valuation Report is an in-depth analysis detailing your home's value as well as a comparison with similar homes in the area
Home Values in the Area
Average Home Value in this Area
Purchase History
| Date | Buyer | Sale Price | Title Company |
|---|---|---|---|
| Schlosberg Mark A | -- | First American Title Company | |
| Schlosberg Mark A | -- | None Available | |
| Schlosberg Mark A | $675,000 | Placer Title Company | |
| Walker Ryan | -- | Placer Title Company | |
| Walker Ryan | -- | First American Title Guarant |
Source: Public Records
Mortgage History
| Date | Status | Borrower | Loan Amount |
|---|---|---|---|
| Open | Schlosberg Mark A | $441,500 | |
| Closed | Walker Ryan | $540,000 | |
| Closed | Schlosberg Mark A | $67,500 |
Source: Public Records
Tax History
| Year | Tax Paid | Tax Assessment Tax Assessment Total Assessment is a certain percentage of the fair market value that is determined by local assessors to be the total taxable value of land and additions on the property. | Land | Improvement |
|---|---|---|---|---|
| 2025 | $13,393 | $904,283 | $271,285 | $632,998 |
| 2024 | $13,393 | $886,557 | $265,967 | $620,590 |
| 2023 | $13,122 | $869,177 | $260,753 | $608,424 |
| 2022 | $12,900 | $852,140 | $255,642 | $596,498 |
| 2021 | $12,940 | $835,433 | $250,630 | $584,803 |
| 2020 | $12,276 | $826,867 | $248,060 | $578,807 |
| 2019 | $11,828 | $810,661 | $243,198 | $567,463 |
| 2018 | $11,640 | $794,771 | $238,431 | $556,340 |
| 2017 | $11,243 | $779,192 | $233,757 | $545,435 |
| 2016 | $10,907 | $763,917 | $229,175 | $534,742 |
| 2015 | $10,766 | $752,448 | $225,734 | $526,714 |
| 2014 | $10,108 | $690,000 | $207,000 | $483,000 |
Source: Public Records
Map
Nearby Homes
- 2013 9th St
- 1050 Allston Way
- 940 Delaware St
- 2241 Ninth St
- 2144 Curtis St
- 1128 Delaware St
- 2220 7th St
- 931 Bancroft Way
- 1919 Curtis St
- 2238 7th St
- 2231 Byron St
- 817 Delaware St
- 2327 10th St Unit 4
- 1261 Hearst Ave
- 995 Virginia St
- 1728 Curtis St
- 1039 Channing Way
- 1207 Francisco St
- 1207 Francisco St Unit 2
- 2324 Browning St
- 2022 9th St
- 2028 9th St
- 939 Addison St
- 2018 Ninth St Unit D
- 2018 9th St Unit H
- 2018 9th St Unit E
- 2018 9th St Unit B
- 2018 9th St Unit G
- 2018 9th St Unit D
- 2018 9th St Unit F
- 2018 9th St Unit C
- 2018 9th St Unit A
- 933 Addison St
- 933 Addison St Unit F
- 933 Addison St Unit C
- 933 Addison St Unit A
- 933 Addison St Unit G
- 933 Addison St Unit D
- 933 Addison St Unit H
- 933 Addison St Unit E
Your Personal Tour Guide
Ask me questions while you tour the home.