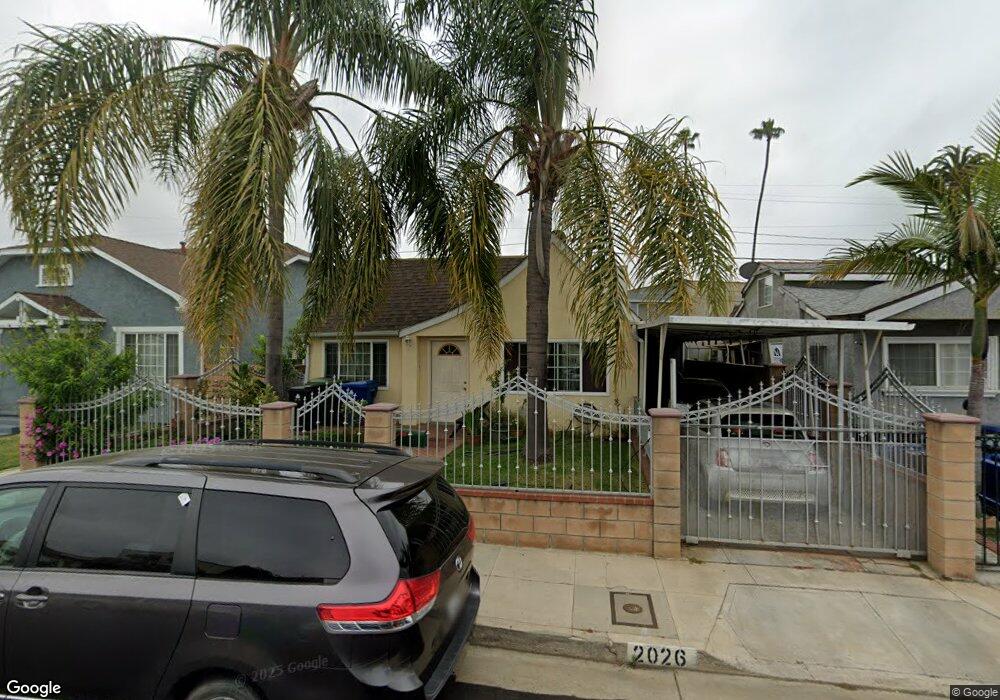
2026 Claudina Ave Los Angeles, CA 90016
Mid-City NeighborhoodEstimated Value: $742,748 - $1,036,000
2
Beds
1
Bath
792
Sq Ft
$1,081/Sq Ft
Est. Value
About This Home
This home is located at 2026 Claudina Ave, Los Angeles, CA 90016 and is currently estimated at $856,437, approximately $1,081 per square foot. 2026 Claudina Ave is a home located in Los Angeles County with nearby schools including Alta Loma Elementary, Johnnie L. Cochran Jr. Middle School, and Los Angeles Senior High School.
Ownership History
Date
Name
Owned For
Owner Type
Purchase Details
Closed on
Oct 23, 2002
Sold by
Garcia Maria R
Bought by
Garcia Arturo
Current Estimated Value
Home Financials for this Owner
Home Financials are based on the most recent Mortgage that was taken out on this home.
Original Mortgage
$145,200
Outstanding Balance
$60,117
Interest Rate
5.99%
Estimated Equity
$796,320
Purchase Details
Closed on
Aug 23, 2002
Sold by
Valladares Sylvia Delrosario
Bought by
Garcia Arturo
Purchase Details
Closed on
Nov 20, 1996
Sold by
Jimenez Dolores
Bought by
Valladares Sylvia Delrosario
Home Financials for this Owner
Home Financials are based on the most recent Mortgage that was taken out on this home.
Original Mortgage
$144,400
Interest Rate
7.91%
Purchase Details
Closed on
Nov 14, 1995
Sold by
Luna Miguel A and Luna Amparo
Bought by
Jimenez Dolores
Create a Home Valuation Report for This Property
The Home Valuation Report is an in-depth analysis detailing your home's value as well as a comparison with similar homes in the area
Home Values in the Area
Average Home Value in this Area
Purchase History
| Date | Buyer | Sale Price | Title Company |
|---|---|---|---|
| Garcia Arturo | -- | -- | |
| Garcia Arturo | -- | Lawyers Title | |
| Valladares Sylvia Delrosario | $152,000 | Commonwealth Land Title Co | |
| Jimenez Dolores | -- | -- |
Source: Public Records
Mortgage History
| Date | Status | Borrower | Loan Amount |
|---|---|---|---|
| Open | Garcia Arturo | $145,200 | |
| Previous Owner | Valladares Sylvia Delrosario | $144,400 |
Source: Public Records
Tax History Compared to Growth
Tax History
| Year | Tax Paid | Tax Assessment Tax Assessment Total Assessment is a certain percentage of the fair market value that is determined by local assessors to be the total taxable value of land and additions on the property. | Land | Improvement |
|---|---|---|---|---|
| 2025 | $2,842 | $217,225 | $181,029 | $36,196 |
| 2024 | $2,842 | $212,967 | $177,480 | $35,487 |
| 2023 | $2,795 | $208,792 | $174,000 | $34,792 |
| 2022 | $2,677 | $204,699 | $170,589 | $34,110 |
| 2021 | $2,640 | $200,687 | $167,245 | $33,442 |
| 2019 | $2,567 | $194,737 | $162,286 | $32,451 |
| 2018 | $2,527 | $190,919 | $159,104 | $31,815 |
| 2016 | $2,419 | $183,508 | $152,927 | $30,581 |
| 2015 | $2,386 | $180,752 | $150,630 | $30,122 |
| 2014 | $2,414 | $177,212 | $147,680 | $29,532 |
Source: Public Records
Map
Nearby Homes
- 2045 Claudina Ave
- 2102 Hillcrest Dr
- 2209 West Blvd
- 2006 S Harcourt Ave
- 2025 West Blvd
- 1938 S Harcourt Ave
- 2331 Lucerne Ave
- 2116 S Palm Grove Ave
- 2353 Lucerne Ave
- 1920 S Rimpau Blvd
- 1931 Buckingham Rd
- 2424 West Blvd
- 4522 Saint Elmo Dr
- 4710 St Elmo Dr
- 4512 St Elmo Dr
- 2531 Hillcrest Dr
- 4901 4905 W 20th St
- 4835 Pickford St
- 2413 S Victoria Ave
- 4725 St Elmo Dr
- 2030 Claudina Ave
- 2022 Claudina Ave
- 2109 Vineyard Ave
- 2115 Vineyard Ave
- 2105 Vineyard Ave
- 2038 Claudina Ave
- 2119 Vineyard Ave
- 2027 Vineyard Ave
- 2044 Claudina Ave
- 2123 Vineyard Ave
- 2021 Vineyard Ave
- 2025 Claudina Ave
- 2031 Claudina Ave
- 2017 Claudina Ave
- 2050 Claudina Ave
- 2010 Claudina Ave
- 2035 Claudina Ave
- 2127 Vineyard Ave
- 2019 Vineyard Ave
- 2013 Claudina Ave