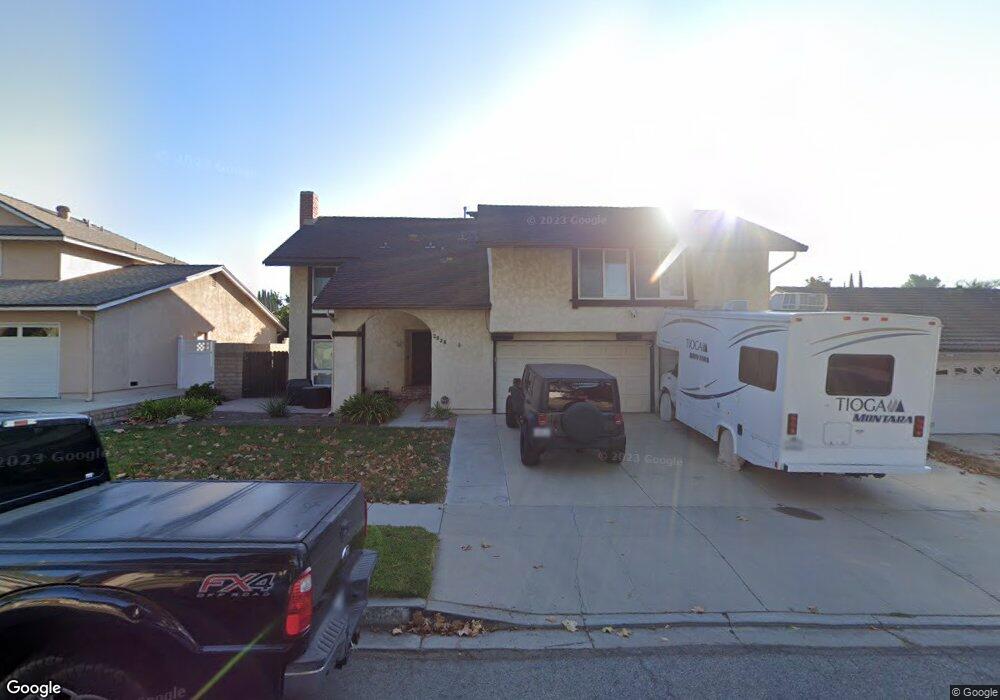
2026 Fernwood Ct Simi Valley, CA 93065
Central Simi Valley NeighborhoodEstimated Value: $897,000 - $948,000
4
Beds
3
Baths
2,695
Sq Ft
$344/Sq Ft
Est. Value
About This Home
This home is located at 2026 Fernwood Ct, Simi Valley, CA 93065 and is currently estimated at $928,194, approximately $344 per square foot. 2026 Fernwood Ct is a home located in Ventura County with nearby schools including Park View Elementary School, Hillside Middle School, and Royal High School.
Ownership History
Date
Name
Owned For
Owner Type
Purchase Details
Closed on
Aug 2, 2017
Sold by
Vandyke James A and Vandyke Cindy L
Bought by
Vandyke James A and Vandyke Cindy L
Current Estimated Value
Purchase Details
Closed on
Jan 21, 1998
Sold by
Ying Yi Fan Andrea L
Bought by
Vandyke James A and Vandyke Cindy L
Home Financials for this Owner
Home Financials are based on the most recent Mortgage that was taken out on this home.
Original Mortgage
$205,200
Outstanding Balance
$35,016
Interest Rate
6.95%
Estimated Equity
$893,178
Create a Home Valuation Report for This Property
The Home Valuation Report is an in-depth analysis detailing your home's value as well as a comparison with similar homes in the area
Home Values in the Area
Average Home Value in this Area
Purchase History
| Date | Buyer | Sale Price | Title Company |
|---|---|---|---|
| Vandyke James A | -- | None Available | |
| Vandyke James A | $216,000 | Investors Title Company |
Source: Public Records
Mortgage History
| Date | Status | Borrower | Loan Amount |
|---|---|---|---|
| Open | Vandyke James A | $205,200 |
Source: Public Records
Tax History Compared to Growth
Tax History
| Year | Tax Paid | Tax Assessment Tax Assessment Total Assessment is a certain percentage of the fair market value that is determined by local assessors to be the total taxable value of land and additions on the property. | Land | Improvement |
|---|---|---|---|---|
| 2025 | $4,421 | $344,854 | $137,940 | $206,914 |
| 2024 | $4,421 | $338,093 | $135,236 | $202,857 |
| 2023 | $4,154 | $331,464 | $132,584 | $198,880 |
| 2022 | $4,123 | $324,965 | $129,984 | $194,981 |
| 2021 | $4,079 | $318,594 | $127,436 | $191,158 |
| 2020 | $3,985 | $315,329 | $126,130 | $189,199 |
| 2019 | $3,801 | $309,147 | $123,657 | $185,490 |
| 2018 | $3,760 | $303,086 | $121,233 | $181,853 |
| 2017 | $3,669 | $297,144 | $118,856 | $178,288 |
| 2016 | $3,501 | $291,319 | $116,526 | $174,793 |
| 2015 | $3,420 | $286,945 | $114,777 | $172,168 |
| 2014 | $3,363 | $281,327 | $112,530 | $168,797 |
Source: Public Records
Map
Nearby Homes
- 2241 Burnside St
- 2163 N Justin Ave
- 2146 N Brower St
- 2349 Knollhaven St
- 2266 Lansdale Ct
- 2405 Lee St
- 1775 Lee St
- 2149 Madrone St
- 2239 McDonald St
- 2091 Marter Ave
- 2357 Lawnview Ct
- 2368 Heywood St
- 1886 Cloud Ct
- 2306 Madrone St
- 1882 Larch St
- 2410 N Justin Ave
- 2291 N Marter Ct
- 2391 Heather St
- 2095 Morley St
- 1948 Heywood St Unit L
- 2044 Fernwood Ct
- 2010 Fernwood Ct
- 2027 N Justin Ave
- 2045 N Justin Ave
- 2011 N Justin Ave
- 2060 Fernwood Ct
- 2025 Fernwood Ct
- 2061 N Justin Ave
- 2043 Fernwood Ct
- 2009 Fernwood Ct
- 2076 Fernwood Ct
- 2059 Fernwood Ct
- 2172 E Brower St
- 2184 E Brower St Unit 221
- 2184 E Brower St
- 2077 N Justin Ave
- 2160 E Brower St
- 2148 E Brower St
- 2075 Fernwood Ct
- 2218 Burnside St