Estimated Value: $297,000 - $348,000
4
Beds
2
Baths
1,409
Sq Ft
$234/Sq Ft
Est. Value
About This Home
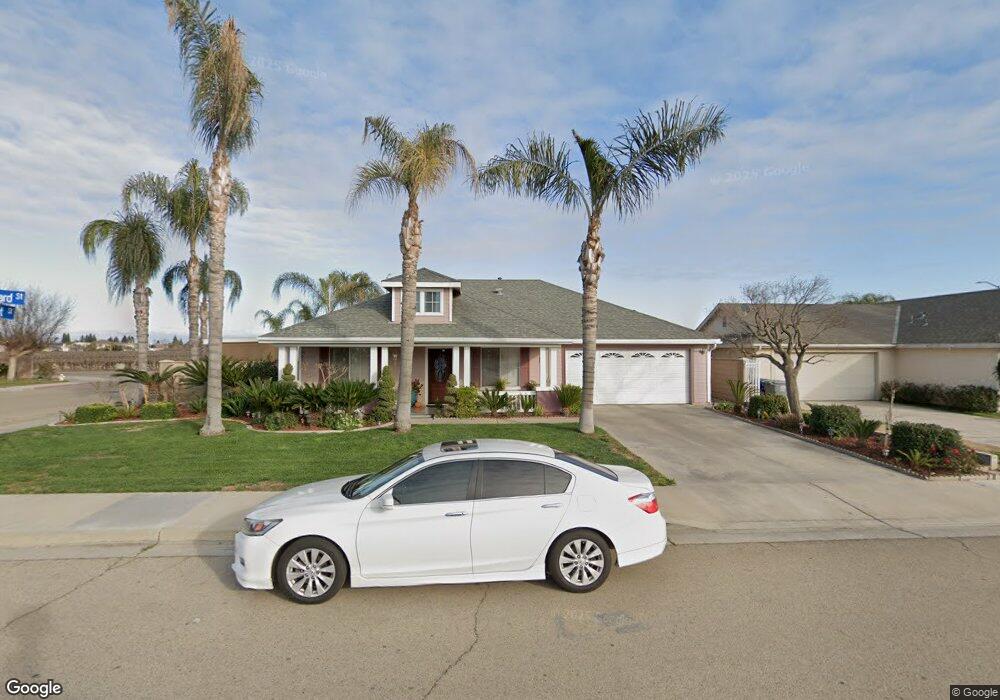
This home is located at 2026 Orchard St, Selma, CA 93662 and is currently estimated at $329,986, approximately $234 per square foot. 2026 Orchard St is a home located in Fresno County with nearby schools including Woodrow Wilson Elementary School, Abraham Lincoln Middle School, and Selma High School.
Ownership History
Date
Name
Owned For
Owner Type
Purchase Details
Closed on
Jul 26, 2017
Sold by
Diaz Pedro and Diaz Pedro
Bought by
Diaz Maricela
Current Estimated Value
Home Financials for this Owner
Home Financials are based on the most recent Mortgage that was taken out on this home.
Original Mortgage
$44,000
Outstanding Balance
$9,804
Interest Rate
3.88%
Mortgage Type
New Conventional
Estimated Equity
$320,182
Purchase Details
Closed on
Mar 30, 1998
Sold by
Mah Suncrest Llc
Bought by
Diaz Pedro and Diaz Maria
Home Financials for this Owner
Home Financials are based on the most recent Mortgage that was taken out on this home.
Original Mortgage
$96,659
Interest Rate
6.73%
Mortgage Type
FHA
Create a Home Valuation Report for This Property
The Home Valuation Report is an in-depth analysis detailing your home's value as well as a comparison with similar homes in the area
Home Values in the Area
Average Home Value in this Area
Purchase History
| Date | Buyer | Sale Price | Title Company |
|---|---|---|---|
| Diaz Maricela | -- | Old Republic Title Concord | |
| Diaz Pedro | $98,000 | Chicago Title Co |
Source: Public Records
Mortgage History
| Date | Status | Borrower | Loan Amount |
|---|---|---|---|
| Open | Diaz Maricela | $44,000 | |
| Previous Owner | Diaz Pedro | $96,659 | |
| Closed | Diaz Pedro | $4,000 |
Source: Public Records
Tax History Compared to Growth
Tax History
| Year | Tax Paid | Tax Assessment Tax Assessment Total Assessment is a certain percentage of the fair market value that is determined by local assessors to be the total taxable value of land and additions on the property. | Land | Improvement |
|---|---|---|---|---|
| 2025 | $2,823 | $152,042 | $47,019 | $105,023 |
| 2023 | $2,328 | $146,141 | $45,195 | $100,946 |
| 2022 | $2,638 | $143,276 | $44,309 | $98,967 |
| 2021 | $2,574 | $140,468 | $43,441 | $97,027 |
| 2020 | $2,543 | $139,029 | $42,996 | $96,033 |
| 2019 | $2,493 | $136,303 | $42,153 | $94,150 |
| 2018 | $2,436 | $133,631 | $41,327 | $92,304 |
| 2017 | $2,344 | $131,012 | $40,517 | $90,495 |
| 2016 | $2,113 | $128,444 | $39,723 | $88,721 |
| 2015 | $2,139 | $126,516 | $39,127 | $87,389 |
| 2014 | $2,081 | $124,039 | $38,361 | $85,678 |
Source: Public Records
Map
Nearby Homes