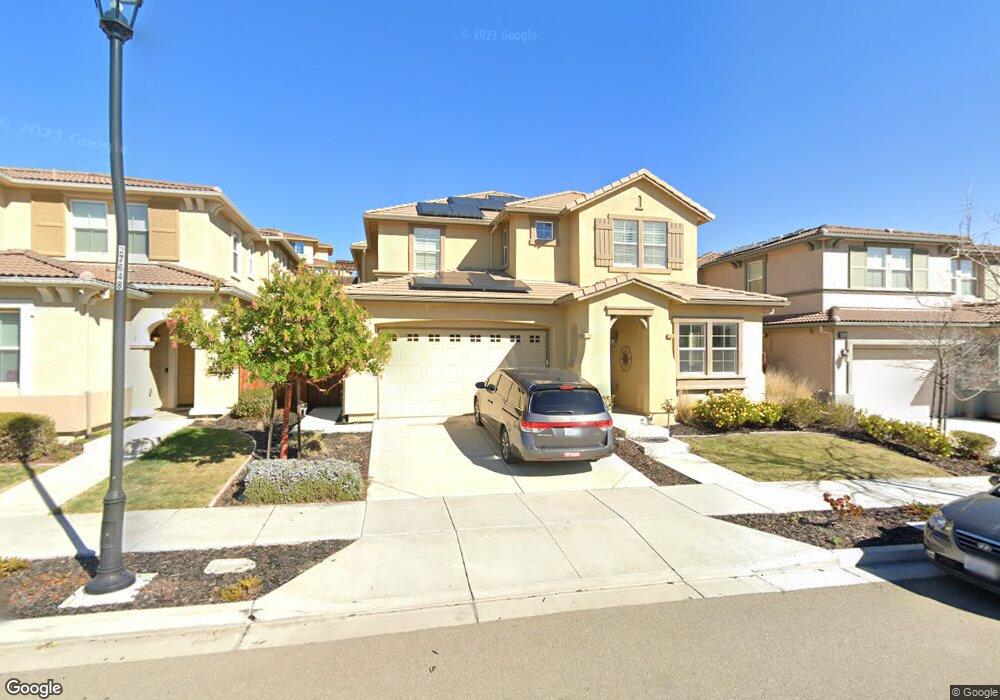
2027 Forino Dr Dublin, CA 94568
Positano NeighborhoodEstimated Value: $2,089,000 - $2,533,394
6
Beds
5
Baths
3,877
Sq Ft
$605/Sq Ft
Est. Value
About This Home
This home is located at 2027 Forino Dr, Dublin, CA 94568 and is currently estimated at $2,345,099, approximately $604 per square foot. 2027 Forino Dr is a home located in Alameda County with nearby schools including J.M. Amador Elementary School, Dublin High School, and SPRINGFIELD MONTESSORI SCHOOL.
Ownership History
Date
Name
Owned For
Owner Type
Purchase Details
Closed on
Dec 3, 2021
Sold by
Nagasamudra Anil K and Nagasamudra Lakshmi A
Bought by
Nagasamudra Revocable Trust
Current Estimated Value
Purchase Details
Closed on
Jun 13, 2014
Sold by
Lodhi Hasan and Hasan Lubna
Bought by
Nagasamudra Anil K and Nagasamudra Lakshmi A
Home Financials for this Owner
Home Financials are based on the most recent Mortgage that was taken out on this home.
Original Mortgage
$904,000
Interest Rate
3.12%
Mortgage Type
Adjustable Rate Mortgage/ARM
Purchase Details
Closed on
Feb 1, 2013
Sold by
K Hovnanian At Positano Llc
Bought by
Lodhi Hasan and Hasan Lubna
Home Financials for this Owner
Home Financials are based on the most recent Mortgage that was taken out on this home.
Original Mortgage
$625,500
Interest Rate
3.29%
Mortgage Type
New Conventional
Create a Home Valuation Report for This Property
The Home Valuation Report is an in-depth analysis detailing your home's value as well as a comparison with similar homes in the area
Home Values in the Area
Average Home Value in this Area
Purchase History
We collect this data history from publicly available records. To have your information removed, we recommend requesting removal directly through your county’s website.
| Date | Buyer | Sale Price | Title Company |
|---|---|---|---|
| Nagasamudra Revocable Trust | -- | None Listed On Document | |
| Nagasamudra Anil K | $1,130,000 | Chicago Title Company | |
| Lodhi Hasan | -- | First American Title Company |
Source: Public Records
Mortgage History
We collect this data history from publicly available records. To have your information removed, we recommend requesting removal directly through your county’s website.
| Date | Status | Borrower | Loan Amount |
|---|---|---|---|
| Previous Owner | Nagasamudra Anil K | $904,000 | |
| Previous Owner | Lodhi Hasan | $625,500 |
Source: Public Records
Tax History
| Year | Tax Paid | Tax Assessment Tax Assessment Total Assessment is a certain percentage of the fair market value that is determined by local assessors to be the total taxable value of land and additions on the property. | Land | Improvement |
|---|---|---|---|---|
| 2025 | $18,377 | $1,378,164 | $416,775 | $968,389 |
| 2024 | $18,377 | $1,352,411 | $408,605 | $949,406 |
| 2023 | $19,034 | $1,331,387 | $400,594 | $930,793 |
| 2022 | $18,716 | $1,305,284 | $392,740 | $912,544 |
| 2021 | $18,567 | $1,279,702 | $385,043 | $894,659 |
| 2020 | $17,412 | $1,266,582 | $381,095 | $885,487 |
| 2019 | $17,358 | $1,241,757 | $373,626 | $868,131 |
| 2018 | $16,951 | $1,217,416 | $366,302 | $851,114 |
| 2017 | $16,750 | $1,193,550 | $359,121 | $834,429 |
| 2016 | $15,299 | $1,170,148 | $352,080 | $818,068 |
| 2015 | $14,723 | $1,152,577 | $346,793 | $805,784 |
| 2014 | $12,730 | $959,636 | $287,891 | $671,745 |
Source: Public Records
Map
Nearby Homes
- 4951 Campanille Ct
- 1718 N Terracina Dr
- 5271 Salerno Dr
- 2560 Calabria Ct
- 2539 Brandini Dr
- 1937 Whitney Ave
- 1697 Savanna Ln
- 1799 Sill Ave
- 4360 Panorama Dr
- 4999 Piper Glen Terrace
- 4367 Panorama Dr
- 4237 Langley Rd
- 2811 E Sugar Hill Terrace
- 1652 Savannah Ct
- 1640 Savanna Ct
- 1949 Michael Ave
- 4316 Sunset View Dr
- 4021 Doyle Rd
- 4266 Sunset View Dr
- 2332 Carbondale Way
- 2015 Forino Dr
- 2039 Forino Dr
- 2001 Forino Dr
- 2057 Forino Dr
- 2036 Avanti Ave
- 2071 Forino Dr
- 2052 Avanti Ave
- 2066 Avanti Ave
- 2024 Avanti Ave
- 2012 Forino Dr
- 1987 Forino Dr
- 2026 Forino Dr
- 2038 Forino Dr
- 2010 Avanti Ave
- 2070 Forino Dr
- 2056 Forino Dr
- 2085 Forino Dr
- 2080 Avanti Ave
- 2000 Forino Dr
- 1996 Avanti Ave
Your Personal Tour Guide
Ask me questions while you tour the home.