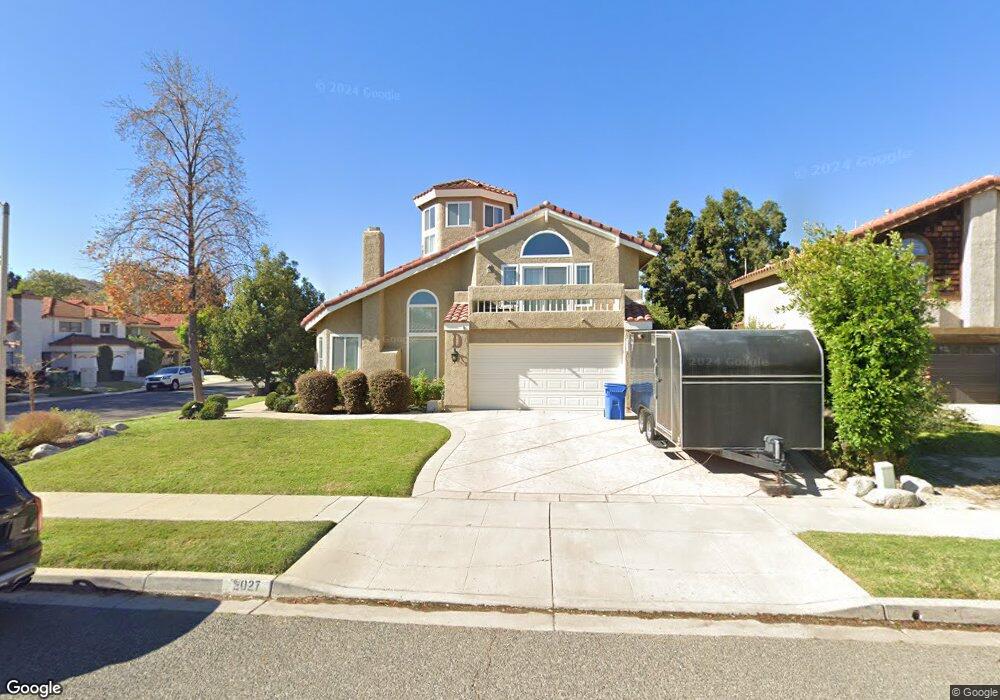
2027 Redman Ct Simi Valley, CA 93063
East Simi Valley NeighborhoodEstimated Value: $955,000 - $1,102,000
4
Beds
3
Baths
2,785
Sq Ft
$369/Sq Ft
Est. Value
About This Home
This home is located at 2027 Redman Ct, Simi Valley, CA 93063 and is currently estimated at $1,027,066, approximately $368 per square foot. 2027 Redman Ct is a home located in Ventura County with nearby schools including Katherine Elementary School, Valley View Middle School, and Simi Valley High School.
Ownership History
Date
Name
Owned For
Owner Type
Purchase Details
Closed on
Sep 18, 2020
Sold by
Diederich Brian and Diederich Melissa
Bought by
Diederich Melissa and Diederich Brian
Current Estimated Value
Home Financials for this Owner
Home Financials are based on the most recent Mortgage that was taken out on this home.
Original Mortgage
$425,000
Outstanding Balance
$340,607
Interest Rate
2.9%
Mortgage Type
New Conventional
Estimated Equity
$686,459
Purchase Details
Closed on
Dec 23, 1998
Sold by
Bourdon Gary M and Bourdon Gail R
Bought by
Diederich Brian and Diederich Melissa
Home Financials for this Owner
Home Financials are based on the most recent Mortgage that was taken out on this home.
Original Mortgage
$255,600
Interest Rate
6.63%
Create a Home Valuation Report for This Property
The Home Valuation Report is an in-depth analysis detailing your home's value as well as a comparison with similar homes in the area
Home Values in the Area
Average Home Value in this Area
Purchase History
| Date | Buyer | Sale Price | Title Company |
|---|---|---|---|
| Diederich Melissa | -- | Fidelity National Title Spl | |
| Diederich Brian | $319,500 | Progressive Title Company |
Source: Public Records
Mortgage History
| Date | Status | Borrower | Loan Amount |
|---|---|---|---|
| Open | Diederich Melissa | $425,000 | |
| Closed | Diederich Brian | $255,600 | |
| Closed | Diederich Brian | $47,900 |
Source: Public Records
Tax History
| Year | Tax Paid | Tax Assessment Tax Assessment Total Assessment is a certain percentage of the fair market value that is determined by local assessors to be the total taxable value of land and additions on the property. | Land | Improvement |
|---|---|---|---|---|
| 2025 | $6,438 | $511,707 | $200,337 | $311,370 |
| 2024 | $6,438 | $501,674 | $196,409 | $305,265 |
| 2023 | $6,065 | $491,838 | $192,558 | $299,280 |
| 2022 | $6,042 | $482,195 | $188,783 | $293,412 |
| 2021 | $6,000 | $472,741 | $185,082 | $287,659 |
| 2020 | $5,880 | $467,895 | $183,185 | $284,710 |
| 2019 | $5,621 | $458,722 | $179,594 | $279,128 |
| 2018 | $5,576 | $449,728 | $176,073 | $273,655 |
| 2017 | $5,456 | $440,911 | $172,621 | $268,290 |
| 2016 | $5,220 | $432,267 | $169,237 | $263,030 |
| 2015 | $5,115 | $425,776 | $166,696 | $259,080 |
| 2014 | $5,046 | $417,438 | $163,432 | $254,006 |
Source: Public Records
Map
Nearby Homes
- 2058 Coleman Ct
- 5502 E Los Angeles Ave Unit 2
- 5502 E Los Angeles Ave Unit 4
- 5502 E Los Angeles Ave Unit 1
- 5502 E Los Angeles Ave Unit 3
- 5510 E Los Angeles Ave Unit 1
- 5510 E Los Angeles Ave Unit 2
- 5510 E Los Angeles Ave Unit 4
- 5510 E Los Angeles Ave Unit 3
- 5518 E Los Angeles Ave Unit 2
- 5518 E Los Angeles Ave Unit 1
- 5518 E Los Angeles Ave Unit 3
- 5518 E Los Angeles Ave Unit 4
- 5526 E Los Angeles Ave Unit 2
- 5526 E Los Angeles Ave Unit 4
- 5526 E Los Angeles Ave Unit 1
- 5526 E Los Angeles Ave Unit 3
- 2024 Tulip Ave
- 2124 Snowberry Ct
- 2228 Oak Haven Ave
- 2035 Redman Ct
- 2024 Kingman Ave
- 2030 Kingman Ave
- 2043 Redman Ct
- 2038 Kingman Ave
- 2044 Kingman Ave
- 5450 Honeyman St
- 2026 Redman Ct
- 2051 Redman Ct
- 5466 Honeyman St
- 2034 Redman Ct
- 5442 Honeyman St
- 2052 Kingman Ave
- 5474 Honeyman St
- 5434 Honeyman St
- 2042 Redman Ct
- 2050 Redman Ct
- 2067 Stilman Ct
- 5482 Honeyman St
- 5415 Honeyman St
Your Personal Tour Guide
Ask me questions while you tour the home.