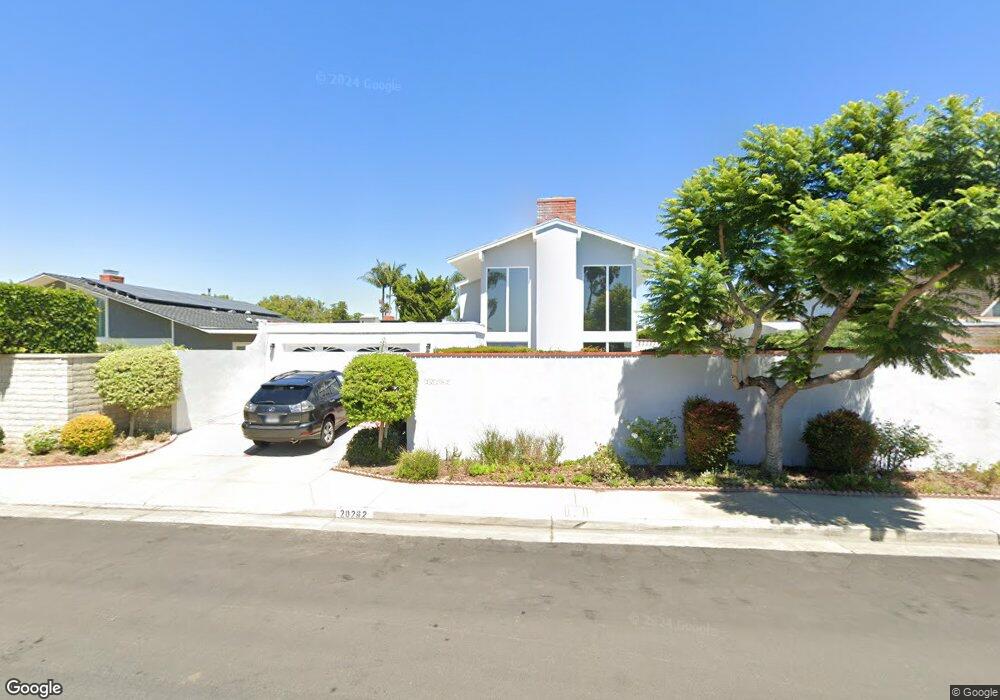
20282 Adrian Cir Huntington Beach, CA 92646
Southeast NeighborhoodEstimated Value: $1,458,000 - $1,988,000
4
Beds
3
Baths
2,330
Sq Ft
$752/Sq Ft
Est. Value
About This Home
This home is located at 20282 Adrian Cir, Huntington Beach, CA 92646 and is currently estimated at $1,751,691, approximately $751 per square foot. 20282 Adrian Cir is a home located in Orange County with nearby schools including Ralph E. Hawes Elementary School, Isaac L. Sowers Middle School, and Edison High School.
Ownership History
Date
Name
Owned For
Owner Type
Purchase Details
Closed on
Sep 26, 2003
Sold by
Movius Maureen
Bought by
Movius Maureen and Maureen Movius Living Trust
Current Estimated Value
Purchase Details
Closed on
May 21, 2003
Sold by
Movius Maureen
Bought by
Movius Maureen
Home Financials for this Owner
Home Financials are based on the most recent Mortgage that was taken out on this home.
Original Mortgage
$147,500
Interest Rate
5.18%
Mortgage Type
Purchase Money Mortgage
Purchase Details
Closed on
Mar 22, 2002
Sold by
Movius Maureen
Bought by
The Maureen Movius Living Trust
Purchase Details
Closed on
Dec 14, 1993
Sold by
Movius Maureen P and Movius Moureen P
Bought by
Movius Maureen P
Home Financials for this Owner
Home Financials are based on the most recent Mortgage that was taken out on this home.
Original Mortgage
$170,000
Interest Rate
7.09%
Create a Home Valuation Report for This Property
The Home Valuation Report is an in-depth analysis detailing your home's value as well as a comparison with similar homes in the area
Home Values in the Area
Average Home Value in this Area
Purchase History
| Date | Buyer | Sale Price | Title Company |
|---|---|---|---|
| Movius Maureen | -- | -- | |
| Movius Maureen | -- | New Century Title Company | |
| The Maureen Movius Living Trust | -- | -- | |
| Movius Maureen P | -- | Continental Lawyers Title Co |
Source: Public Records
Mortgage History
| Date | Status | Borrower | Loan Amount |
|---|---|---|---|
| Closed | Movius Maureen | $147,500 | |
| Closed | Movius Maureen P | $170,000 |
Source: Public Records
Tax History Compared to Growth
Tax History
| Year | Tax Paid | Tax Assessment Tax Assessment Total Assessment is a certain percentage of the fair market value that is determined by local assessors to be the total taxable value of land and additions on the property. | Land | Improvement |
|---|---|---|---|---|
| 2025 | $4,759 | $403,995 | $191,733 | $212,262 |
| 2024 | $4,759 | $396,074 | $187,974 | $208,100 |
| 2023 | $4,650 | $388,308 | $184,288 | $204,020 |
| 2022 | $4,528 | $380,695 | $180,675 | $200,020 |
| 2021 | $4,446 | $373,231 | $177,132 | $196,099 |
| 2020 | $4,416 | $369,404 | $175,315 | $194,089 |
| 2019 | $4,366 | $362,161 | $171,877 | $190,284 |
| 2018 | $4,299 | $355,060 | $168,507 | $186,553 |
| 2017 | $4,242 | $348,099 | $165,203 | $182,896 |
| 2016 | $4,059 | $341,274 | $161,964 | $179,310 |
| 2015 | $4,020 | $336,148 | $159,531 | $176,617 |
| 2014 | $3,936 | $329,564 | $156,406 | $173,158 |
Source: Public Records
Map
Nearby Homes
- 9522 Yellowstone Dr
- 20111 Marina Ln
- 20071 Moontide Cir
- 20258 Lantana Dr
- 20380 Flora Ln
- 19901 Burnley Ln
- 9695 Adams Ave
- 19846 Lures Ln
- 9667 Durham Dr
- 9594 Pettswood Dr Unit 4
- 9812 La Cresta Cir
- 8932 Amador Cir Unit 1309B
- 20862 Lancelot Ln
- 9882 Hot Springs Dr
- 9745 Cornwall Dr
- 8886 Plumas Cir Unit 1124-A
- 20392 Redwood Ln
- 19843 Coventry Ln
- 19860 Claremont Ln
- 8856 526C Sutter
- 20292 Adrian Cir
- 20272 Adrian Cir
- 20281 Bancroft Cir
- 20271 Bancroft Cir
- 20291 Bancroft Cir
- 20312 Adrian Cir
- 20252 Adrian Cir
- 20281 Adrian Cir
- 20311 Bancroft Cir
- 20291 Adrian Cir
- 20271 Adrian Cir
- 20251 Bancroft Cir
- 20322 Adrian Cir
- 20311 Adrian Cir
- 20251 Adrian Cir
- 20321 Bancroft Cir
- 20282 Bancroft Cir
- 20282 Ramona Ln
- 20242 Adrian Cir
- 20292 Ramona Ln