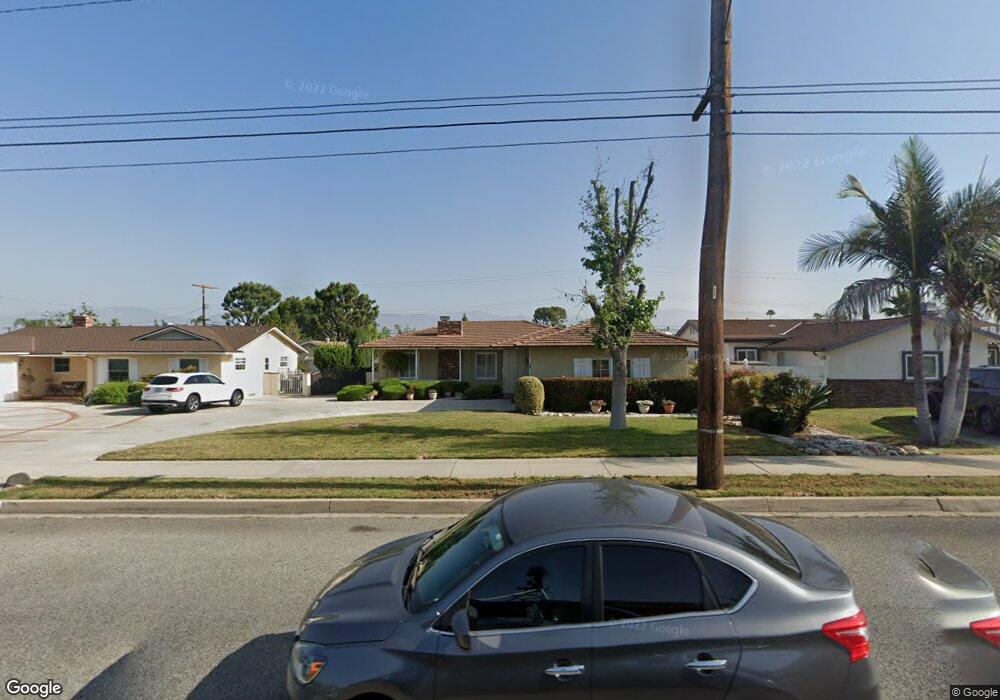
2029 E Cortez St West Covina, CA 91791
South Hills NeighborhoodEstimated Value: $790,691 - $857,000
3
Beds
2
Baths
1,378
Sq Ft
$601/Sq Ft
Est. Value
About This Home
This home is located at 2029 E Cortez St, West Covina, CA 91791 and is currently estimated at $828,673, approximately $601 per square foot. 2029 E Cortez St is a home located in Los Angeles County with nearby schools including Vine Elementary School, Hollencrest Middle School, and West Covina High School.
Ownership History
Date
Name
Owned For
Owner Type
Purchase Details
Closed on
Nov 21, 2017
Sold by
Chu Isaac Nan Ping
Bought by
Chu Isaac Nan Ping and Shih Debby Hui Ping
Current Estimated Value
Purchase Details
Closed on
Mar 9, 2002
Sold by
Shih Debby Hui Ping
Bought by
Chu Isaac Nan Ping
Create a Home Valuation Report for This Property
The Home Valuation Report is an in-depth analysis detailing your home's value as well as a comparison with similar homes in the area
Home Values in the Area
Average Home Value in this Area
Purchase History
| Date | Buyer | Sale Price | Title Company |
|---|---|---|---|
| Chu Isaac Nan Ping | -- | None Available | |
| Chu Isaac Nan Ping | -- | -- | |
| Chu Andrew Nan Hung | -- | -- | |
| Chu Isaac Nan Ping | -- | -- |
Source: Public Records
Tax History Compared to Growth
Tax History
| Year | Tax Paid | Tax Assessment Tax Assessment Total Assessment is a certain percentage of the fair market value that is determined by local assessors to be the total taxable value of land and additions on the property. | Land | Improvement |
|---|---|---|---|---|
| 2025 | $5,016 | $390,920 | $235,844 | $155,076 |
| 2024 | $5,016 | $383,256 | $231,220 | $152,036 |
| 2023 | $4,771 | $375,742 | $226,687 | $149,055 |
| 2022 | $4,809 | $368,376 | $222,243 | $146,133 |
| 2021 | $4,676 | $361,154 | $217,886 | $143,268 |
| 2019 | $4,552 | $350,443 | $211,424 | $139,019 |
| 2018 | $4,316 | $343,573 | $207,279 | $136,294 |
| 2017 | $4,221 | $336,837 | $203,215 | $133,622 |
| 2016 | $3,948 | $330,233 | $199,231 | $131,002 |
| 2015 | $3,870 | $325,274 | $196,239 | $129,035 |
| 2014 | $3,850 | $318,903 | $192,395 | $126,508 |
Source: Public Records
Map
Nearby Homes
- 631 S Hillward Ave
- 1940 E Walnut Creek Pkwy
- 2147 E Rio Verde Dr
- 640 S Azusa Ave
- 802 S Hollenbeck St
- 2249 E Rio Verde Dr
- 1717 Cabrillo
- 859 S Hillward Ave
- 235 S Azusa Ave
- 213 S Meadow Rd
- 110 S Baymar St
- 910 S Donna Beth Ave
- 2407 E Walnut Creek Pkwy
- 401 S Cherrywood St
- 131 S Myrtlewood St
- 1681 Aspen Village Way
- 2551 E Larkwood St
- 1715 E Mardina St
- 1536 E Norma Ave
- 1103 Novarro St
- 2035 E Cortez St
- 2023 E Cortez St
- 2028 E Olin Place
- 2039 E Cortez St
- 2017 E Cortez St
- 2034 E Olin Place
- 2038 E Olin Place
- 2016 E Olin Place
- 2030 E Cortez St
- 2022 E Cortez St
- 2045 E Cortez St
- 2034 E Cortez St
- 2016 E Cortez St
- 2044 E Olin Place
- 2051 E Cortez St
- 2036 E Cortez St
- 529 S Hillward Ave
- 525 S Hillward Ave
- 2029 E Olin Place
- 2050 E Olin Place