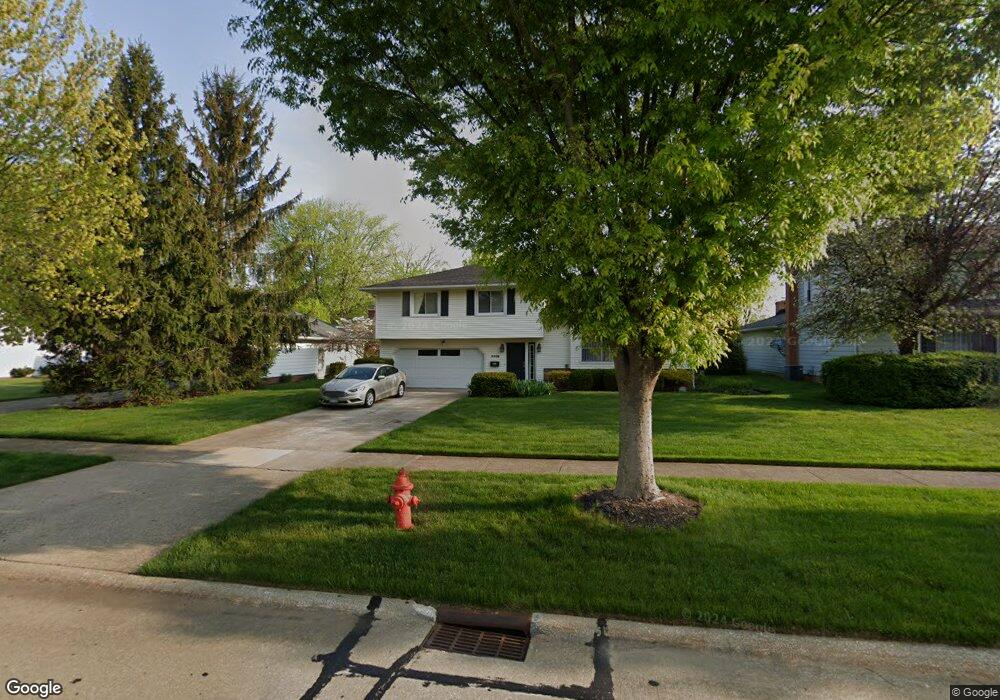
2029 Edenhall Dr Cleveland, OH 44124
Estimated Value: $273,000 - $287,000
3
Beds
2
Baths
1,294
Sq Ft
$215/Sq Ft
Est. Value
About This Home
This home is located at 2029 Edenhall Dr, Cleveland, OH 44124 and is currently estimated at $278,393, approximately $215 per square foot. 2029 Edenhall Dr is a home located in Cuyahoga County with nearby schools including Sunview Elementary School, Greenview Upper Elementary School, and Memorial Junior High School.
Ownership History
Date
Name
Owned For
Owner Type
Purchase Details
Closed on
Oct 24, 2019
Sold by
Occhionero Denise M and Maichle John A
Bought by
Maichle John A and Occhionero Denise M
Current Estimated Value
Purchase Details
Closed on
Sep 13, 2000
Sold by
Cheyfitz Edward D
Bought by
Occhionero Denise M
Home Financials for this Owner
Home Financials are based on the most recent Mortgage that was taken out on this home.
Original Mortgage
$66,000
Outstanding Balance
$24,123
Interest Rate
8.14%
Estimated Equity
$254,270
Purchase Details
Closed on
May 30, 1989
Sold by
Brown Kenneth B
Bought by
Cheyfitz Edward D
Purchase Details
Closed on
Dec 30, 1977
Sold by
Zamiska Joseph L
Bought by
Brown Kenneth B
Purchase Details
Closed on
Sep 7, 1977
Sold by
Zamiska Joseph L and Zamiska Yolanda
Bought by
Zamiska Joseph L
Purchase Details
Closed on
Jan 1, 1975
Bought by
Zamiska Joseph L and Zamiska Yolanda
Create a Home Valuation Report for This Property
The Home Valuation Report is an in-depth analysis detailing your home's value as well as a comparison with similar homes in the area
Home Values in the Area
Average Home Value in this Area
Purchase History
| Date | Buyer | Sale Price | Title Company |
|---|---|---|---|
| Maichle John A | -- | None Available | |
| Occhionero Denise M | $161,000 | Guardian Title | |
| Cheyfitz Edward D | $110,000 | -- | |
| Brown Kenneth B | $59,000 | -- | |
| Zamiska Joseph L | -- | -- | |
| Zamiska Joseph L | -- | -- |
Source: Public Records
Mortgage History
| Date | Status | Borrower | Loan Amount |
|---|---|---|---|
| Open | Occhionero Denise M | $66,000 |
Source: Public Records
Tax History Compared to Growth
Tax History
| Year | Tax Paid | Tax Assessment Tax Assessment Total Assessment is a certain percentage of the fair market value that is determined by local assessors to be the total taxable value of land and additions on the property. | Land | Improvement |
|---|---|---|---|---|
| 2024 | $5,927 | $84,385 | $20,265 | $64,120 |
| 2023 | $5,808 | $66,750 | $15,470 | $51,280 |
| 2022 | $5,775 | $66,750 | $15,470 | $51,280 |
| 2021 | $5,726 | $66,750 | $15,470 | $51,280 |
| 2020 | $5,928 | $60,690 | $14,070 | $46,620 |
| 2019 | $5,676 | $173,400 | $40,200 | $133,200 |
| 2018 | $5,034 | $60,690 | $14,070 | $46,620 |
| 2017 | $4,782 | $49,810 | $13,760 | $36,050 |
| 2016 | $4,745 | $49,810 | $13,760 | $36,050 |
| 2015 | $4,420 | $49,810 | $13,760 | $36,050 |
| 2014 | $4,420 | $46,560 | $12,850 | $33,710 |
Source: Public Records
Map
Nearby Homes
- 5560 Lansbury Ln
- 1857 Brainard Rd
- 1856 Bremerton Rd
- 1842 Aldersgate Dr
- 1775 Brainard Rd
- 1839 Caronia Dr
- 1922 Winchester Rd
- 250 Eagle Point Dr
- 5688 Shawnee Dr
- 5824 Tiffany Ct Unit 5824
- 5814 Tiffany Ct
- 1763 Temple Ave
- 2112 Acacia Park Dr Unit 214
- 2112 Acacia Park Dr Unit 220
- 2112 Acacia Park Dr Unit 319
- 2112 Acacia Park Dr Unit 524
- 5831 Alberta Dr
- 2237 Glouchester Dr
- 5706 York Dr Unit 5706
- 2202 Acacia Park Dr Unit 2714
- 2035 Edenhall Dr
- 2021 Edenhall Dr
- 2043 Edenhall Dr
- 2013 Edenhall Dr
- 2005 Edenhall Dr
- 2051 Edenhall Dr
- 2028 Edenhall Dr
- 2020 Edenhall Dr
- 2036 Edenhall Dr
- 2044 Edenhall Dr
- 1993 Edenhall Dr
- 2059 Edenhall Dr
- 2004 Edenhall Dr
- 2052 Edenhall Dr
- 2067 Edenhall Dr
- 1981 Edenhall Dr
- 2029 Aldersgate Dr
- 2021 Aldersgate Dr
- 1992 Edenhall Dr
- 2060 Edenhall Dr