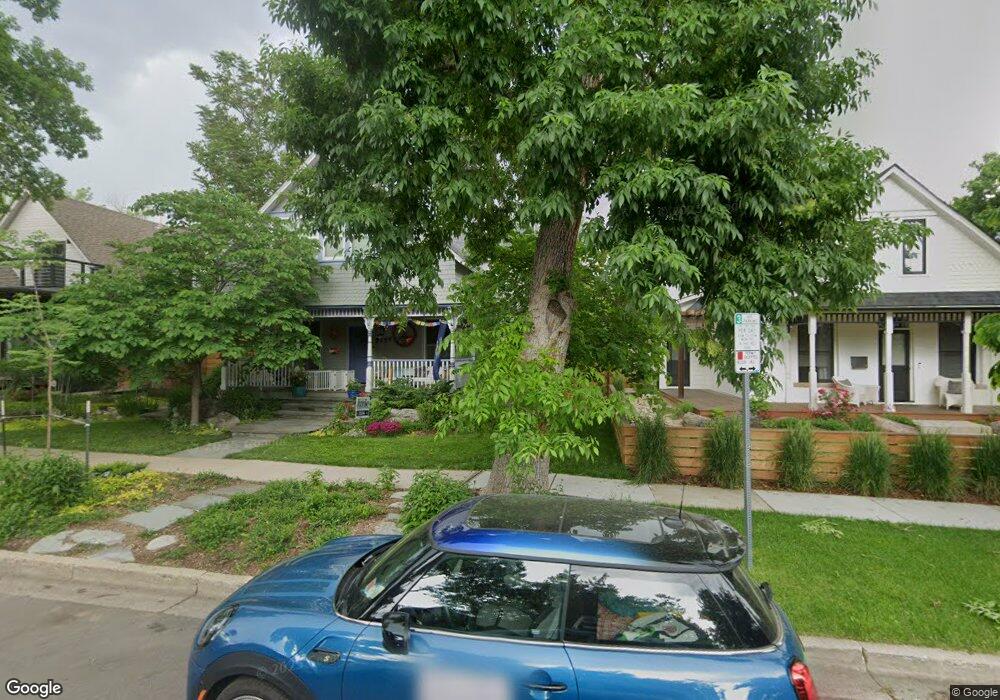
2029 Mapleton Ave Boulder, CO 80304
Whittier NeighborhoodEstimated Value: $2,470,835 - $3,192,000
5
Beds
3
Baths
2,688
Sq Ft
$1,014/Sq Ft
Est. Value
About This Home
This home is located at 2029 Mapleton Ave, Boulder, CO 80304 and is currently estimated at $2,726,459, approximately $1,014 per square foot. 2029 Mapleton Ave is a home located in Boulder County with nearby schools including Whittier Elementary School, Casey Middle School, and Boulder High School.
Ownership History
Date
Name
Owned For
Owner Type
Purchase Details
Closed on
Jul 16, 2009
Sold by
Shafroth William G and Shafroth Erica Forbes
Bought by
Hill Catherine W
Current Estimated Value
Home Financials for this Owner
Home Financials are based on the most recent Mortgage that was taken out on this home.
Original Mortgage
$417,000
Interest Rate
5.39%
Mortgage Type
Purchase Money Mortgage
Purchase Details
Closed on
Jun 27, 1994
Sold by
Mountain Helen Winsor
Bought by
Shafroth William G
Home Financials for this Owner
Home Financials are based on the most recent Mortgage that was taken out on this home.
Original Mortgage
$230,000
Interest Rate
6.87%
Purchase Details
Closed on
Dec 13, 1985
Bought by
Hill Catherine W and Hill Graham
Purchase Details
Closed on
Jul 30, 1976
Bought by
Hill Catherine W and Hill Graham
Create a Home Valuation Report for This Property
The Home Valuation Report is an in-depth analysis detailing your home's value as well as a comparison with similar homes in the area
Home Values in the Area
Average Home Value in this Area
Purchase History
| Date | Buyer | Sale Price | Title Company |
|---|---|---|---|
| Hill Catherine W | $955,000 | Htco | |
| Shafroth William G | $410,000 | First American Heritage Titl | |
| Hill Catherine W | $180,000 | -- | |
| Hill Catherine W | $57,500 | -- |
Source: Public Records
Mortgage History
| Date | Status | Borrower | Loan Amount |
|---|---|---|---|
| Closed | Hill Catherine W | $417,000 | |
| Previous Owner | Shafroth William G | $230,000 |
Source: Public Records
Tax History
| Year | Tax Paid | Tax Assessment Tax Assessment Total Assessment is a certain percentage of the fair market value that is determined by local assessors to be the total taxable value of land and additions on the property. | Land | Improvement |
|---|---|---|---|---|
| 2025 | $15,322 | $159,762 | $69,275 | $90,487 |
| 2024 | $15,322 | $159,762 | $69,275 | $90,487 |
| 2023 | $15,056 | $174,341 | $72,950 | $105,076 |
| 2022 | $12,807 | $137,914 | $56,934 | $80,980 |
| 2021 | $12,213 | $141,883 | $58,573 | $83,310 |
| 2020 | $11,893 | $136,629 | $50,193 | $86,436 |
| 2019 | $17,884 | $208,644 | $50,193 | $158,451 |
| 2018 | $9,563 | $110,304 | $43,992 | $66,312 |
| 2017 | $9,264 | $121,947 | $48,636 | $73,311 |
| 2016 | $8,086 | $93,410 | $37,253 | $56,157 |
| 2015 | $7,657 | $76,584 | $34,706 | $41,878 |
| 2014 | $6,439 | $76,584 | $34,706 | $41,878 |
Source: Public Records
Map
Nearby Homes
- 2230 20th St
- 2324 19th St
- 1938 Spruce St
- 2447 20th St
- 2225 Pine St
- 2236 17th St
- 1709 Pine St Unit 3
- 2240 Bluff St
- 2201 Pearl St Unit 224
- 2201 Pearl St Unit 118
- 1843 Walnut St Unit B
- 1837 Walnut St Unit E
- 1895 Alpine Ave Unit G21
- 1895 Alpine Ave Unit E18
- 1749 Alpine Ave Unit 10
- 2304 Pearl St Unit 2
- 1916 23rd St Unit 6
- 1707 Walnut St Unit 203
- 1707 Walnut St Unit 307
- 1707 Walnut St Unit 208
- 2021 Mapleton Ave
- 2037 Mapleton Ave
- 2013 Mapleton Ave
- 2045 Mapleton Ave
- 2005 Mapleton Ave
- 2053 Mapleton Ave
- 2322 20th St
- 2327 21st St
- 2321 21st St
- 2338 20th St
- 2032 Bluff St
- 2028 Bluff St
- 2016 Bluff St
- 2332 20th St
- 2044 Bluff St
- 2333 21st St
- 2030 Mapleton Ave
- 2020 Mapleton Ave
- 2036 Mapleton Ave
- 2010 Bluff St
Your Personal Tour Guide
Ask me questions while you tour the home.