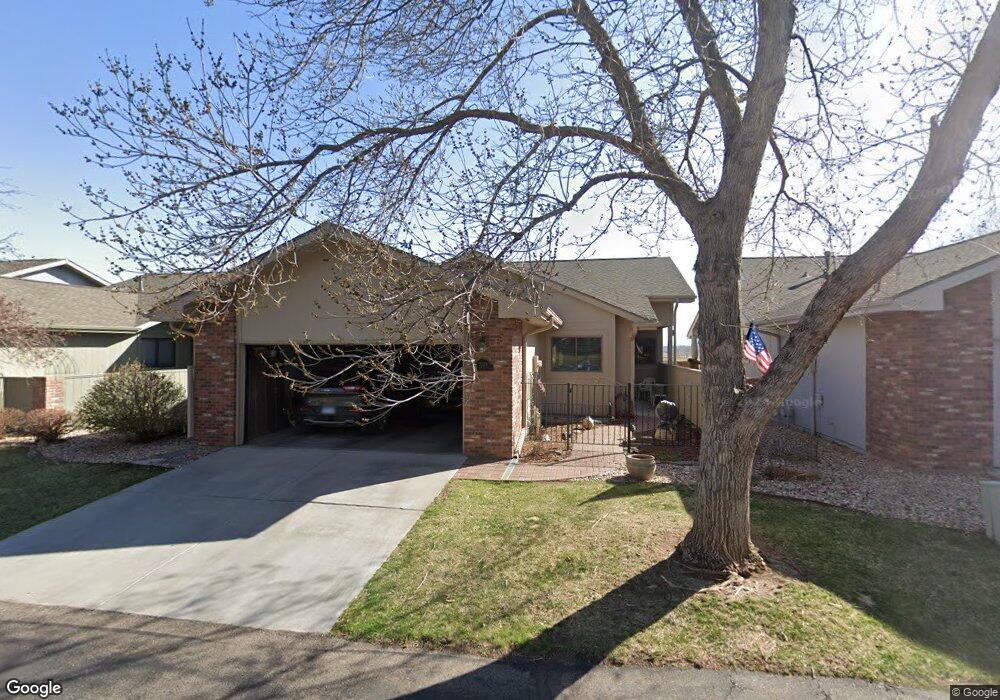
2029 S View Cir Unit 16 Fort Collins, CO 80524
Estimated Value: $597,250 - $641,000
4
Beds
3
Baths
2,803
Sq Ft
$221/Sq Ft
Est. Value
About This Home
This home is located at 2029 S View Cir Unit 16, Fort Collins, CO 80524 and is currently estimated at $619,813, approximately $221 per square foot. 2029 S View Cir Unit 16 is a home located in Larimer County with nearby schools including Tavelli Elementary School, Lincoln Middle School, and Poudre High School.
Ownership History
Date
Name
Owned For
Owner Type
Purchase Details
Closed on
Apr 30, 2025
Sold by
Meline Arvilla C and Crawford Arvilla Elaine
Bought by
Glover Family Living Trust
Current Estimated Value
Purchase Details
Closed on
Aug 15, 2005
Sold by
Oneil Carlton N and Oneil Dorothy K
Bought by
Meline Victor R and Meline Arvilla E
Home Financials for this Owner
Home Financials are based on the most recent Mortgage that was taken out on this home.
Original Mortgage
$125,000
Interest Rate
5.65%
Mortgage Type
Credit Line Revolving
Purchase Details
Closed on
Jun 29, 1998
Sold by
Thielen Kenneth Robert and Thielen Leonella A
Bought by
Oneil Carlton N and Oneil Dorothy K
Home Financials for this Owner
Home Financials are based on the most recent Mortgage that was taken out on this home.
Original Mortgage
$80,000
Interest Rate
7.21%
Purchase Details
Closed on
Jun 1, 1995
Sold by
Gould Dick Inc
Bought by
Thielen Kenneth Robert
Create a Home Valuation Report for This Property
The Home Valuation Report is an in-depth analysis detailing your home's value as well as a comparison with similar homes in the area
Home Values in the Area
Average Home Value in this Area
Purchase History
| Date | Buyer | Sale Price | Title Company |
|---|---|---|---|
| Glover Family Living Trust | $615,000 | Land Title | |
| Meline Victor R | $308,000 | Security Title | |
| Oneil Carlton N | $220,000 | -- | |
| Thielen Kenneth Robert | $185,800 | -- |
Source: Public Records
Mortgage History
| Date | Status | Borrower | Loan Amount |
|---|---|---|---|
| Previous Owner | Meline Victor R | $125,000 | |
| Previous Owner | Meline Victor R | $110,000 | |
| Previous Owner | Oneil Carlton N | $80,000 |
Source: Public Records
Tax History Compared to Growth
Tax History
| Year | Tax Paid | Tax Assessment Tax Assessment Total Assessment is a certain percentage of the fair market value that is determined by local assessors to be the total taxable value of land and additions on the property. | Land | Improvement |
|---|---|---|---|---|
| 2025 | $2,857 | $39,778 | $2,506 | $37,272 |
| 2024 | $2,720 | $39,778 | $2,506 | $37,272 |
| 2022 | $2,463 | $32,755 | $2,599 | $30,156 |
| 2021 | $2,485 | $33,698 | $2,674 | $31,024 |
| 2020 | $2,148 | $29,901 | $2,674 | $27,227 |
| 2019 | $2,158 | $29,901 | $2,674 | $27,227 |
| 2018 | $1,981 | $28,750 | $2,693 | $26,057 |
| 2017 | $1,974 | $28,750 | $2,693 | $26,057 |
| 2016 | $1,671 | $26,109 | $2,977 | $23,132 |
| 2015 | $2,387 | $26,110 | $2,980 | $23,130 |
| 2014 | $2,145 | $23,310 | $2,980 | $20,330 |
Source: Public Records
Map
Nearby Homes
- 1311 S View Cir
- 1643 Adriel Dr Unit 1643
- 1545 Adriel Ct Unit 1545
- 1604 Heber Dr
- 1508 Linden Lake Rd
- 2126 Friar Tuck Ct
- 2221 Chesapeake Dr
- 2146 Walbridge Rd
- 2279 E Suniga Rd
- 2285 E Suniga Rd
- 2291 E Suniga Rd
- 2297 E Suniga Rd
- 2234 Walbridge Rd
- 2150 Sherwood Forest Ct
- 2290 Walbridge Rd
- 2379 E Suniga Rd
- 2302 Walbridge Rd
- 1412 Wimbledon Ct
- 802 Emmerson Blvd
- 2344 Walbridge Rd
- 2023 S View Cir
- 2035 S View Cir
- 2017 S View Cir
- 2041 S View Cir Unit 18
- 2011 S View Cir
- 2047 S View Cir Unit 19
- 2037 Adriel Dr Unit 24
- 2043 Adriel Dr
- 2005 S View Cir
- 1317 S View Cir
- 2049 Adriel Dr
- 1963 Adriel Dr
- 1957 Adriel Dr
- 1951 Adriel Dr Unit 9
- 1965 S View Dr Unit 31
- 1959 S View Dr Unit 32
- 1945 Adriel Dr Unit 8
- 2055 Adriel Dr
- 1953 S View Dr Unit 33
- 1947 S View Dr