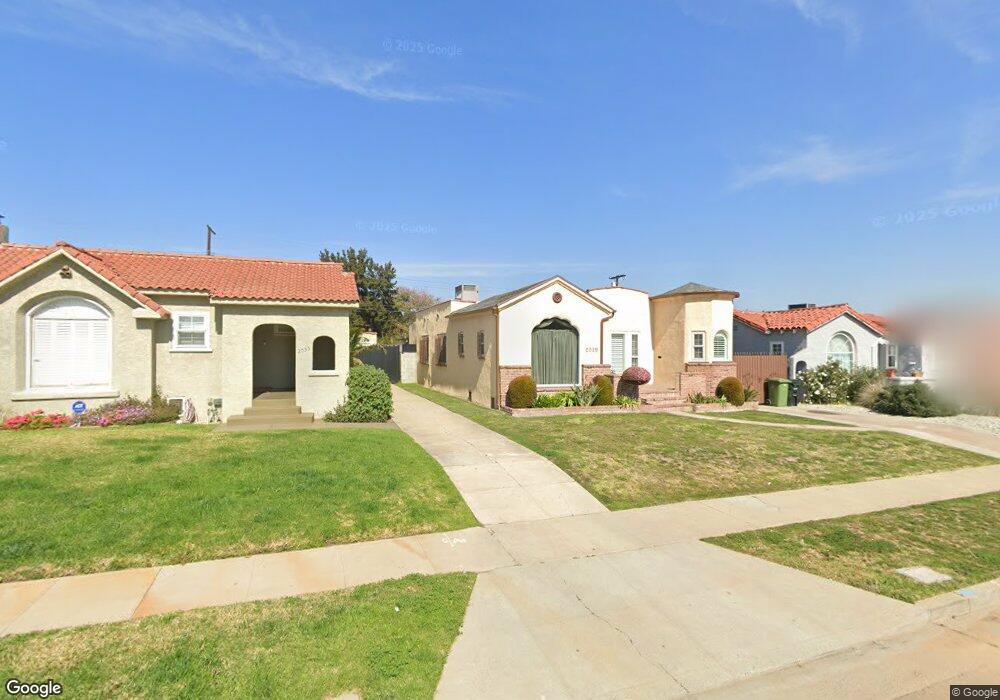
2029 W 85th St Los Angeles, CA 90047
Manchester Square NeighborhoodEstimated Value: $732,000 - $839,000
3
Beds
1
Bath
1,521
Sq Ft
$516/Sq Ft
Est. Value
About This Home
This home is located at 2029 W 85th St, Los Angeles, CA 90047 and is currently estimated at $784,467, approximately $515 per square foot. 2029 W 85th St is a home located in Los Angeles County with nearby schools including La Salle Avenue Elementary School, Horace Mann Ucla Community, and George Washington Preparatory High School.
Ownership History
Date
Name
Owned For
Owner Type
Purchase Details
Closed on
Jul 24, 2021
Sold by
Hall-Smith Harriet Regina
Bought by
Harriet Regina Hall-Smith Separate Property T and Hall-Smith
Current Estimated Value
Home Financials for this Owner
Home Financials are based on the most recent Mortgage that was taken out on this home.
Original Mortgage
$260,000
Interest Rate
3.09%
Mortgage Type
New Conventional
Purchase Details
Closed on
Jun 17, 2011
Sold by
Hall Smith Harriet Regina and Hall Harriet
Bought by
Hall Smith Harriet Regina and The Harriet Regina Hall Smith
Purchase Details
Closed on
Apr 11, 2001
Sold by
Siglar George K
Bought by
Hall Harriet
Home Financials for this Owner
Home Financials are based on the most recent Mortgage that was taken out on this home.
Original Mortgage
$150,350
Interest Rate
7.1%
Create a Home Valuation Report for This Property
The Home Valuation Report is an in-depth analysis detailing your home's value as well as a comparison with similar homes in the area
Home Values in the Area
Average Home Value in this Area
Purchase History
| Date | Buyer | Sale Price | Title Company |
|---|---|---|---|
| Harriet Regina Hall-Smith Separate Property T | -- | Simplifile | |
| Hall-Smith Harriet Regina | -- | Simplifile | |
| Hall Smith Harriet Regina | -- | None Available | |
| Hall Harriet | $155,000 | Commonwealth Title |
Source: Public Records
Mortgage History
| Date | Status | Borrower | Loan Amount |
|---|---|---|---|
| Previous Owner | Hall-Smith Harriet Regina | $260,000 | |
| Previous Owner | Hall Harriet | $150,350 |
Source: Public Records
Tax History Compared to Growth
Tax History
| Year | Tax Paid | Tax Assessment Tax Assessment Total Assessment is a certain percentage of the fair market value that is determined by local assessors to be the total taxable value of land and additions on the property. | Land | Improvement |
|---|---|---|---|---|
| 2025 | $3,881 | $308,183 | $180,218 | $127,965 |
| 2024 | $3,881 | $302,141 | $176,685 | $125,456 |
| 2023 | $3,813 | $296,218 | $173,221 | $122,997 |
| 2022 | $3,646 | $290,411 | $169,825 | $120,586 |
| 2021 | $3,592 | $284,718 | $166,496 | $118,222 |
| 2019 | $3,488 | $276,274 | $161,558 | $114,716 |
| 2018 | $3,368 | $270,858 | $158,391 | $112,467 |
| 2016 | $3,209 | $260,342 | $152,242 | $108,100 |
| 2015 | $3,163 | $256,433 | $149,956 | $106,477 |
| 2014 | $3,182 | $251,411 | $147,019 | $104,392 |
Source: Public Records
Map
Nearby Homes
- 1956 W 84th Place
- 1900 W 85th St
- 1932 W 84th St
- 2132 W 84th Place
- 2124 W Manchester Ave
- 8719 Cimarron St
- 1838 W 88th Place
- 8464 Byrd Ave
- 1951 W 81st St
- 8759 S Hobart Blvd
- 1850 W 80th St
- 8779 S Hobart Blvd
- 1937 W 80th St
- 8620 S 4th Ave
- 2505 W Manchester Blvd
- 1950 W 79th St
- 1728 W 81st St
- 1659 W 83rd St
- 8014 S Western Ave
- 1945 W 91st Place
- 2023 W 85th St
- 2033 W 85th St
- 2037 W 85th St
- 2019 W 85th St
- 2015 W 85th St
- 2041 W 85th St
- 2028 W 84th Place
- 2032 W 84th Place
- 2022 W 84th Place
- 2036 W 84th Place
- 2018 W 84th Place
- 2011 W 85th St
- 2045 W 85th St
- 2014 W 84th Place
- 2040 W 84th Place
- 2028 W 85th St
- 2022 W 85th St
- 2032 W 85th St
- 2018 W 85th St
- 2007 W 85th St