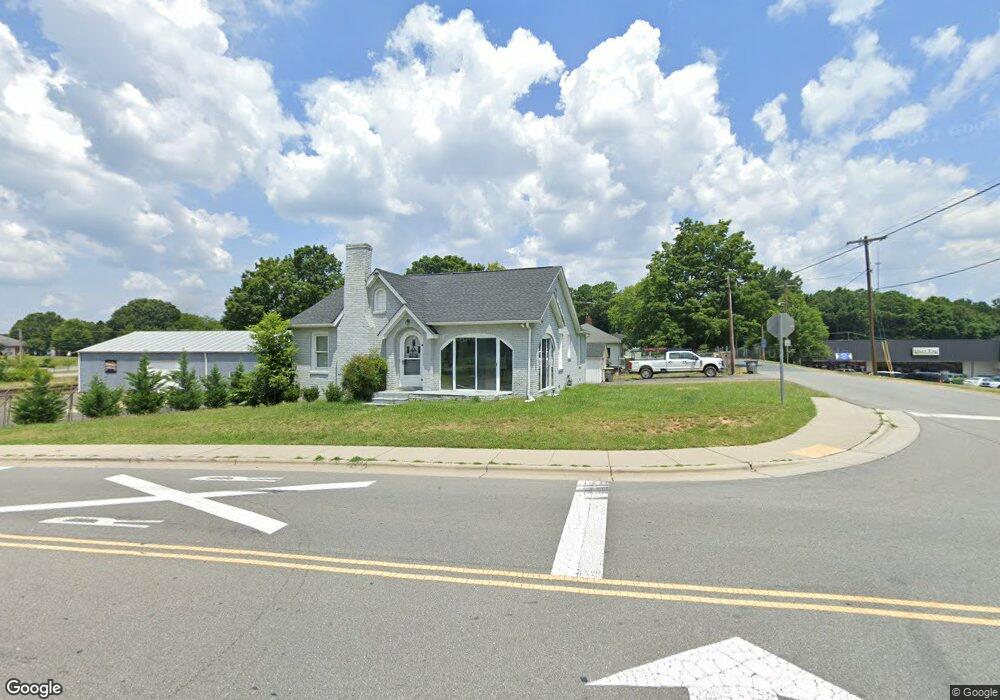
203 E 22nd St Unit Corner Lot, level Kannapolis, NC 28083
Estimated Value: $248,000 - $275,756
3
Beds
1
Bath
1,351
Sq Ft
$189/Sq Ft
Est. Value
About This Home
This home is located at 203 E 22nd St Unit Corner Lot, level, Kannapolis, NC 28083 and is currently estimated at $255,939, approximately $189 per square foot. 203 E 22nd St Unit Corner Lot, level is a home located in Rowan County with nearby schools including Landis Elementary School, Corriher Lipe Middle School, and South Rowan High School.
Ownership History
Date
Name
Owned For
Owner Type
Purchase Details
Closed on
Nov 12, 2025
Sold by
Aghor Angelo Obiang
Bought by
Roberts Ileana D
Current Estimated Value
Home Financials for this Owner
Home Financials are based on the most recent Mortgage that was taken out on this home.
Original Mortgage
$193,070
Outstanding Balance
$193,070
Interest Rate
6.34%
Mortgage Type
FHA
Estimated Equity
$62,869
Purchase Details
Closed on
Jun 1, 2022
Sold by
Jesse Brea
Bought by
Agbor Angelo Obiang
Home Financials for this Owner
Home Financials are based on the most recent Mortgage that was taken out on this home.
Original Mortgage
$234,000
Interest Rate
5.1%
Mortgage Type
New Conventional
Purchase Details
Closed on
Aug 13, 2020
Sold by
Kannapolis Properties Llc
Bought by
Brea Destiny and Brea Jesse
Home Financials for this Owner
Home Financials are based on the most recent Mortgage that was taken out on this home.
Original Mortgage
$162,011
Interest Rate
3%
Mortgage Type
FHA
Purchase Details
Closed on
Oct 31, 2019
Sold by
Troutman Daine Reid
Bought by
Kannapolis Properties Llc
Create a Home Valuation Report for This Property
The Home Valuation Report is an in-depth analysis detailing your home's value as well as a comparison with similar homes in the area
Home Values in the Area
Average Home Value in this Area
Purchase History
| Date | Buyer | Sale Price | Title Company |
|---|---|---|---|
| Roberts Ileana D | $253,000 | None Listed On Document | |
| Agbor Angelo Obiang | $260,000 | None Listed On Document | |
| Brea Destiny | $165,000 | Statewide Title Inc | |
| Kannapolis Properties Llc | $80,000 | None Available |
Source: Public Records
Mortgage History
| Date | Status | Borrower | Loan Amount |
|---|---|---|---|
| Open | Roberts Ileana D | $193,070 | |
| Previous Owner | Agbor Angelo Obiang | $234,000 | |
| Previous Owner | Brea Destiny | $162,011 |
Source: Public Records
Tax History
| Year | Tax Paid | Tax Assessment Tax Assessment Total Assessment is a certain percentage of the fair market value that is determined by local assessors to be the total taxable value of land and additions on the property. | Land | Improvement |
|---|---|---|---|---|
| 2025 | $2,690 | $222,322 | $70,946 | $151,376 |
| 2024 | $2,690 | $222,322 | $70,946 | $151,376 |
| 2023 | $2,690 | $222,322 | $70,946 | $151,376 |
| 2022 | $1,485 | $115,351 | $58,277 | $57,074 |
| 2021 | $1,485 | $115,351 | $58,277 | $57,074 |
| 2020 | $1,485 | $115,351 | $58,277 | $57,074 |
| 2019 | $1,485 | $115,351 | $58,277 | $57,074 |
| 2018 | $1,352 | $106,217 | $58,235 | $47,982 |
| 2017 | $1,352 | $106,217 | $58,235 | $47,982 |
| 2016 | $1,352 | $106,217 | $58,235 | $47,982 |
| 2015 | $1,373 | $106,217 | $58,235 | $47,982 |
| 2014 | $1,273 | $101,858 | $36,366 | $65,492 |
Source: Public Records
Map
Nearby Homes
- 2003 Plaza Ave
- 408 E 22nd St
- 323 E 20th St
- 2410 Summit Ave
- 2406 Brookside Ave
- 2417 Summit Ave
- 513 Sand Dunes Dr
- 286 W 18th St
- 292 W 18th St
- 246 W 18th St
- 258 W 18th St
- 240 W 18th St
- 252 W 18th St
- 537 Sand Dunes Dr
- 526 Sand Dunes Dr
- 310 W 18th St
- 245 W 18th St
- 275 W 18th St
- 227 W 18th St
- 251 W 18th St
- 2201 Linda Ave
- 200 E 22nd St
- 2105 Linda Ave
- 2203 Linda Ave
- 2104 Linda Ave
- 2205 Linda Ave
- 2102 Linda Ave
- 203 E 21st St
- 205 E 21st St
- 2207 Linda Ave
- 0 W 22nd St
- 207 E 21st St
- 2100 Linda Ave
- 2103 N Cannon Blvd
- 209 E 21st St
- 0 E 22nd St
- 105 W 22nd St Unit 69,79
- 104 W 22nd St
- 202 E 21st St
- 2002 Linda Ave
Your Personal Tour Guide
Ask me questions while you tour the home.