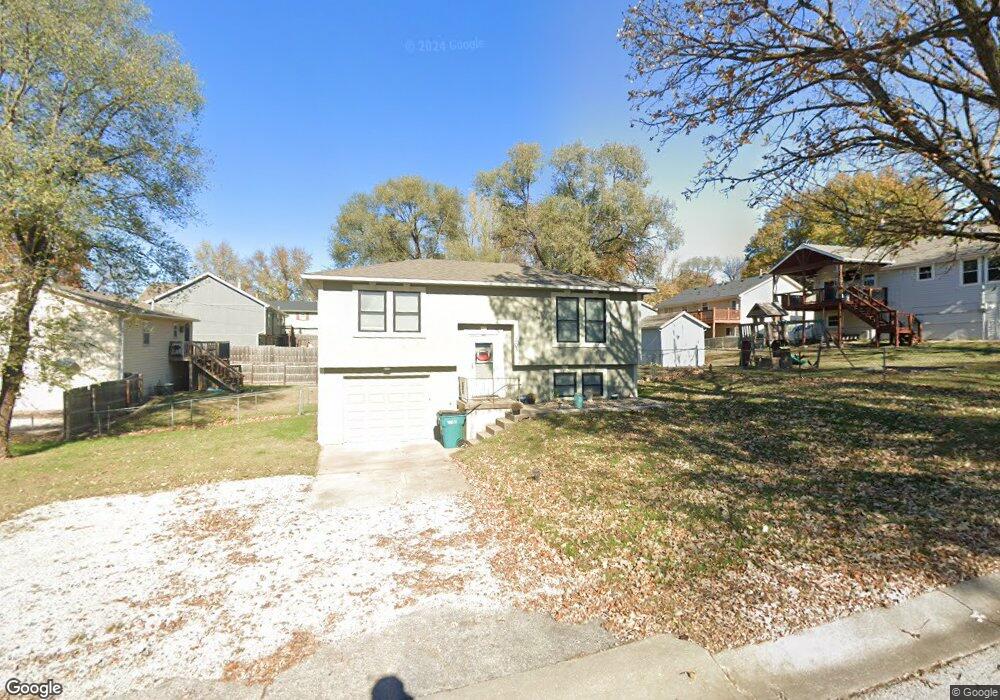
203 E Connie St Lansing, KS 66043
Estimated Value: $224,984 - $251,000
3
Beds
3
Baths
858
Sq Ft
$273/Sq Ft
Est. Value
About This Home
This home is located at 203 E Connie St, Lansing, KS 66043 and is currently estimated at $233,996, approximately $272 per square foot. 203 E Connie St is a home located in Leavenworth County with nearby schools including Lansing Elementary School, Lansing Middle 6-8, and Lansing High 9-12.
Ownership History
Date
Name
Owned For
Owner Type
Purchase Details
Closed on
Sep 9, 2022
Sold by
Georgia Brown
Bought by
Row18 Llc
Current Estimated Value
Home Financials for this Owner
Home Financials are based on the most recent Mortgage that was taken out on this home.
Original Mortgage
$176,000
Outstanding Balance
$168,107
Interest Rate
5.22%
Mortgage Type
New Conventional
Estimated Equity
$65,889
Purchase Details
Closed on
Feb 10, 2022
Sold by
Cook Rose M
Bought by
Brown Georgia
Purchase Details
Closed on
Jul 1, 1986
Bought by
Cook Rose M
Home Financials for this Owner
Home Financials are based on the most recent Mortgage that was taken out on this home.
Original Mortgage
$80,704
Interest Rate
10.62%
Mortgage Type
New Conventional
Create a Home Valuation Report for This Property
The Home Valuation Report is an in-depth analysis detailing your home's value as well as a comparison with similar homes in the area
Home Values in the Area
Average Home Value in this Area
Purchase History
| Date | Buyer | Sale Price | Title Company |
|---|---|---|---|
| Row18 Llc | -- | New Title Company Name | |
| Brown Georgia | -- | None Listed On Document | |
| Cook Rose M | $55,000 | -- |
Source: Public Records
Mortgage History
| Date | Status | Borrower | Loan Amount |
|---|---|---|---|
| Open | Row18 Llc | $176,000 | |
| Previous Owner | Cook Rose M | $80,704 | |
| Closed | Cook Rose M | $85,600 |
Source: Public Records
Tax History
| Year | Tax Paid | Tax Assessment Tax Assessment Total Assessment is a certain percentage of the fair market value that is determined by local assessors to be the total taxable value of land and additions on the property. | Land | Improvement |
|---|---|---|---|---|
| 2025 | $1,366 | $27,519 | $1,925 | $25,594 |
| 2024 | $1,366 | $26,956 | $1,925 | $25,031 |
| 2023 | $1,366 | $11,035 | $1,806 | $9,229 |
| 2022 | $1,655 | $14,409 | $1,559 | $12,850 |
| 2021 | $1,655 | $11,687 | $1,559 | $10,128 |
| 2020 | $1,533 | $10,679 | $1,559 | $9,120 |
| 2019 | $2,042 | $10,200 | $1,559 | $8,641 |
| 2018 | $1,427 | $9,949 | $1,559 | $8,390 |
| 2017 | $1,255 | $8,772 | $1,559 | $7,213 |
| 2016 | $1,243 | $8,684 | $1,559 | $7,125 |
| 2015 | $1,239 | $8,684 | $1,559 | $7,125 |
| 2014 | $1,234 | $8,824 | $1,559 | $7,265 |
Source: Public Records
Map
Nearby Homes
- 134 Debra St
- 1102 N Main St
- 1100 N 4th St
- 1102 N 4th St
- 4 Eisenhower Rd
- 114 Emile St
- 1017 Pebble Beach Dr
- 1101 Pebble Beach Dr
- 00000 Brookwood St
- 530 Holiday Ct
- 20958 Ida St
- 950 Holiday Dr
- Lot 2 Eisenhower Rd
- 124 S Main St
- 202 S Main St
- 218 E Kay St
- 704 Highland Dr
- 728 Eisenhower Rd
- 215 E Mary St
- 804 Glenview St
Your Personal Tour Guide
Ask me questions while you tour the home.