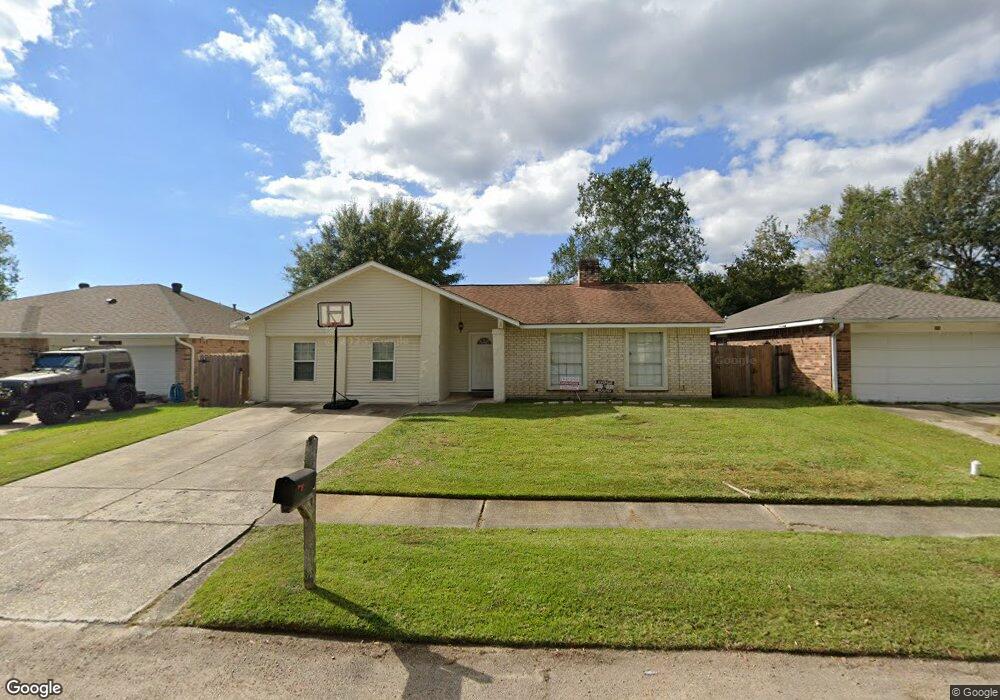
203 E Queens Dr Slidell, LA 70458
Estimated Value: $164,000 - $191,987
4
Beds
2
Baths
1,774
Sq Ft
$103/Sq Ft
Est. Value
About This Home
This home is located at 203 E Queens Dr, Slidell, LA 70458 and is currently estimated at $182,247, approximately $102 per square foot. 203 E Queens Dr is a home located in St. Tammany Parish with nearby schools including Whispering Forest Elementary School, Clearwood Junior High School, and Northshore High School.
Ownership History
Date
Name
Owned For
Owner Type
Purchase Details
Closed on
May 9, 2019
Sold by
Bmrc Properties Llc
Bought by
Crockett Eusheka
Current Estimated Value
Purchase Details
Closed on
Feb 20, 2019
Sold by
St Tammany Parish Sheriff
Bought by
Bmrc Properties Llc
Purchase Details
Closed on
Jan 28, 2009
Sold by
Fishback Donna Sheppard and Fishback Charles R
Bought by
Jones Kristin Strater and Jones Jason B
Home Financials for this Owner
Home Financials are based on the most recent Mortgage that was taken out on this home.
Original Mortgage
$127,500
Interest Rate
5.06%
Mortgage Type
New Conventional
Create a Home Valuation Report for This Property
The Home Valuation Report is an in-depth analysis detailing your home's value as well as a comparison with similar homes in the area
Home Values in the Area
Average Home Value in this Area
Purchase History
| Date | Buyer | Sale Price | Title Company |
|---|---|---|---|
| Crockett Eusheka | $195,000 | Title Management Group Inc | |
| Bmrc Properties Llc | $108,100 | Land Title | |
| Jones Kristin Strater | $125,000 | Stewart Title Of Louisiana | |
| Jones Kristin Strater | $125,000 | Stewart Title Of Louisiana |
Source: Public Records
Mortgage History
| Date | Status | Borrower | Loan Amount |
|---|---|---|---|
| Previous Owner | Jones Kristin Strater | $127,500 |
Source: Public Records
Tax History
| Year | Tax Paid | Tax Assessment Tax Assessment Total Assessment is a certain percentage of the fair market value that is determined by local assessors to be the total taxable value of land and additions on the property. | Land | Improvement |
|---|---|---|---|---|
| 2025 | $1,950 | $15,215 | $1,928 | $13,287 |
| 2024 | $1,950 | $15,215 | $1,928 | $13,287 |
| 2023 | $2,029 | $12,147 | $1,928 | $10,219 |
| 2022 | $176,144 | $12,147 | $1,928 | $10,219 |
| 2021 | $1,759 | $12,147 | $1,928 | $10,219 |
| 2020 | $1,649 | $11,429 | $1,872 | $9,557 |
| 2019 | $1,763 | $11,793 | $1,872 | $9,921 |
| 2018 | $1,769 | $11,793 | $1,872 | $9,921 |
| 2017 | $1,841 | $11,793 | $1,872 | $9,921 |
| 2016 | $1,883 | $11,793 | $1,872 | $9,921 |
| 2015 | $697 | $11,339 | $1,800 | $9,539 |
| 2014 | $685 | $11,339 | $1,800 | $9,539 |
| 2013 | -- | $11,339 | $1,800 | $9,539 |
Source: Public Records
Map
Nearby Homes
- 205 E Queens Dr
- 201 E Queens Dr
- 205 E Queens Other
- 207 E Queens Dr
- 202 Bishops Dr
- 204 E Queens Dr
- 204 Bishops Dr
- 202 E Queens Dr
- 200 Bishops Dr
- 206 Bishops Dr
- 209 E Queens Dr
- 127 E Queens Dr
- 200 E Queens Dr
- 118 Bishops Dr
- 208 Bishops Dr
- 210 E Queens Dr
- 125 E Queens None
- 211 E Queens Dr
- 126 E Queens Dr
- 125 E Queens Dr
Your Personal Tour Guide
Ask me questions while you tour the home.