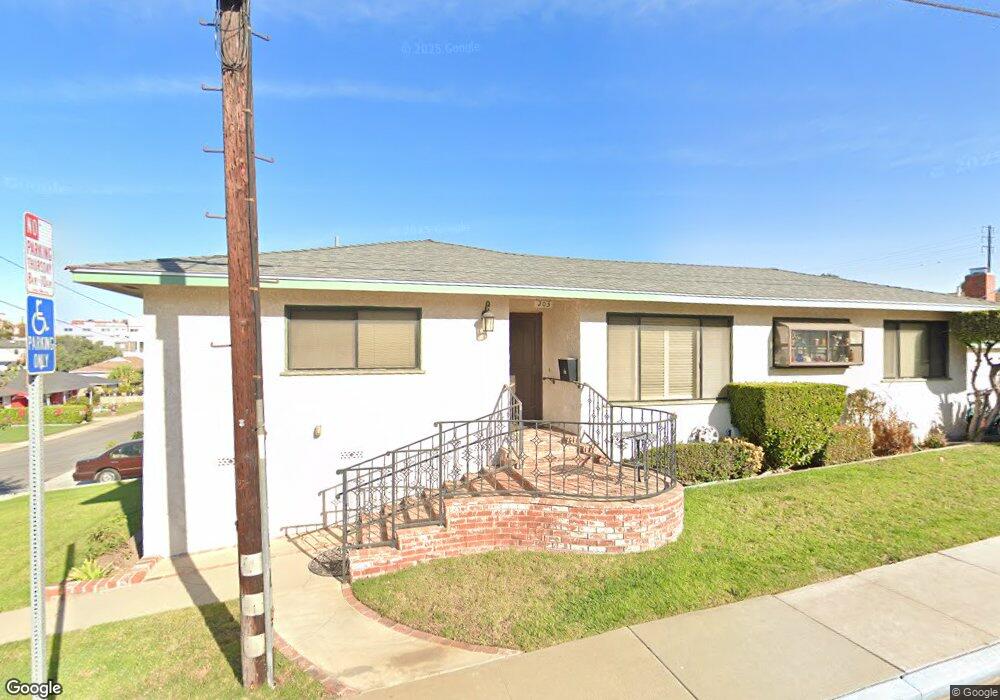
203 E Sycamore Ave El Segundo, CA 90245
Estimated Value: $1,818,297 - $2,348,000
3
Beds
2
Baths
2,196
Sq Ft
$939/Sq Ft
Est. Value
About This Home
This home is located at 203 E Sycamore Ave, El Segundo, CA 90245 and is currently estimated at $2,063,074, approximately $939 per square foot. 203 E Sycamore Ave is a home located in Los Angeles County with nearby schools including Center Street Elementary, El Segundo Middle School, and El Segundo High School.
Ownership History
Date
Name
Owned For
Owner Type
Purchase Details
Closed on
Jun 29, 2021
Sold by
Nivans David B
Bought by
David Brian Nivans Separate Property Trust and Nivans
Current Estimated Value
Purchase Details
Closed on
Mar 4, 2016
Sold by
Nivans David Brian
Bought by
Nivans David B
Purchase Details
Closed on
Nov 17, 2005
Sold by
Nivans Vernon E and Nivans Martha L
Bought by
Nivans Vernon E
Create a Home Valuation Report for This Property
The Home Valuation Report is an in-depth analysis detailing your home's value as well as a comparison with similar homes in the area
Home Values in the Area
Average Home Value in this Area
Purchase History
| Date | Buyer | Sale Price | Title Company |
|---|---|---|---|
| David Brian Nivans Separate Property Trust | -- | None Listed On Document | |
| Nivans David B | -- | None Available | |
| Nivans Vernon E | -- | -- |
Source: Public Records
Tax History
| Year | Tax Paid | Tax Assessment Tax Assessment Total Assessment is a certain percentage of the fair market value that is determined by local assessors to be the total taxable value of land and additions on the property. | Land | Improvement |
|---|---|---|---|---|
| 2025 | $1,768 | $142,987 | $54,882 | $88,105 |
| 2024 | $1,768 | $140,184 | $53,806 | $86,378 |
| 2023 | $1,730 | $137,436 | $52,751 | $84,685 |
| 2022 | $1,743 | $134,742 | $51,717 | $83,025 |
| 2021 | $1,711 | $132,101 | $50,703 | $81,398 |
| 2020 | $1,680 | $130,748 | $50,184 | $80,564 |
| 2019 | $1,656 | $128,185 | $49,200 | $78,985 |
| 2018 | $1,487 | $125,673 | $48,236 | $77,437 |
| 2016 | $1,417 | $120,795 | $46,364 | $74,431 |
| 2015 | $1,400 | $118,981 | $45,668 | $73,313 |
| 2014 | $1,383 | $116,651 | $44,774 | $71,877 |
Source: Public Records
Map
Nearby Homes
- 121 E Walnut Ave
- 924 Main St
- 935 Main St Unit 303
- 212 E Imperial Ave Unit A
- 212 E Imperial Ave Unit E
- 329 E Maple Ave
- 219 W Acacia Ave
- 426 E Imperial Ave
- 529 E Walnut Ave
- 572 E Imperial Ave
- 710 Virginia St
- 955 Virginia St
- 211 E Pine Ave
- 906 E Imperial Ave
- 606 Penn St
- 724 Loma Vista St
- 417 Standard St
- 529 Sierra Place
- 412 Richmond St
- 860 Bungalow Dr
- 836 Pepper St
- 826 Pepper St
- 840 Pepper St
- 209 E Sycamore Ave
- 822 Pepper St
- 844 Pepper St
- 213 E Sycamore Ave
- 214 E Sycamore Ave
- 831 Pepper St
- 835 Pepper St
- 829 Pepper St
- 216 E Sycamore Ave
- 818 Pepper St
- 825 Pepper St
- 848 Pepper St
- 843 Pepper St
- 217 E Sycamore Ave
- 821 Pepper St
- 218 E Sycamore Ave
- 847 Pepper St
Your Personal Tour Guide
Ask me questions while you tour the home.