Estimated Value: $1,232,000 - $1,432,000
4
Beds
3
Baths
1,866
Sq Ft
$689/Sq Ft
Est. Value
About This Home
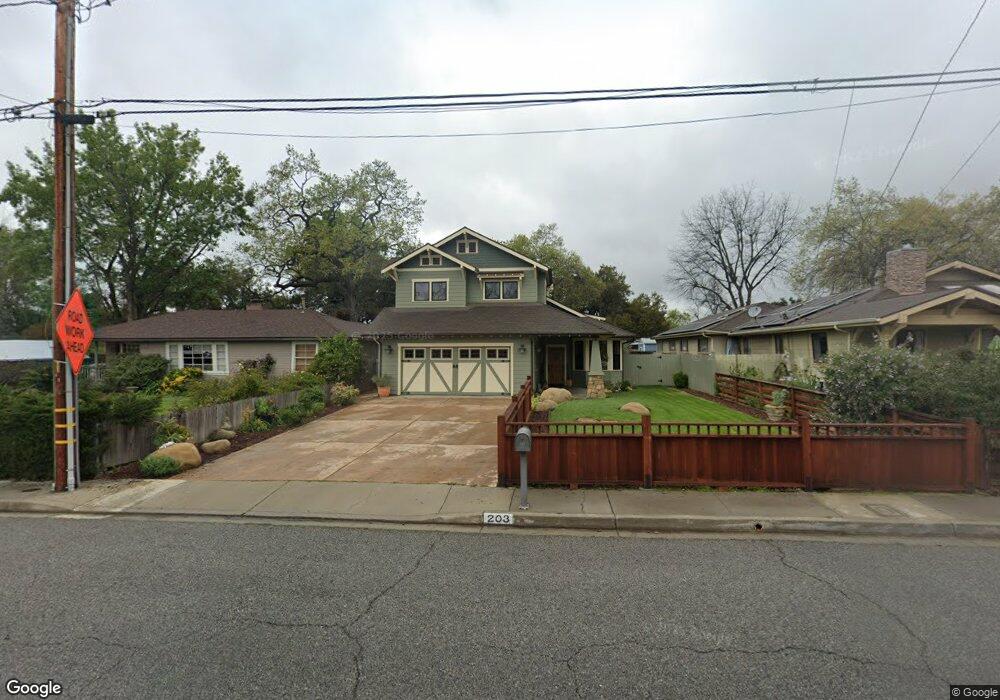
This home is located at 203 Park Rd, Ojai, CA 93023 and is currently estimated at $1,286,352, approximately $689 per square foot. 203 Park Rd is a home located in Ventura County with nearby schools including Topa Topa Elementary School, Meiners Oaks Elementary School, and Matilija Junior High.
Ownership History
Date
Name
Owned For
Owner Type
Purchase Details
Closed on
Feb 4, 2009
Sold by
Simms Vance and Simms Cheryl
Bought by
Fitch Thomas M and Fitch Molly R
Current Estimated Value
Home Financials for this Owner
Home Financials are based on the most recent Mortgage that was taken out on this home.
Original Mortgage
$110,500
Outstanding Balance
$70,077
Interest Rate
5.08%
Mortgage Type
Stand Alone Second
Estimated Equity
$1,216,275
Create a Home Valuation Report for This Property
The Home Valuation Report is an in-depth analysis detailing your home's value as well as a comparison with similar homes in the area
Home Values in the Area
Average Home Value in this Area
Purchase History
| Date | Buyer | Sale Price | Title Company |
|---|---|---|---|
| Fitch Thomas M | -- | Fidelity National Title Co |
Source: Public Records
Mortgage History
| Date | Status | Borrower | Loan Amount |
|---|---|---|---|
| Open | Fitch Thomas M | $110,500 | |
| Open | Fitch Thomas M | $520,000 |
Source: Public Records
Tax History
| Year | Tax Paid | Tax Assessment Tax Assessment Total Assessment is a certain percentage of the fair market value that is determined by local assessors to be the total taxable value of land and additions on the property. | Land | Improvement |
|---|---|---|---|---|
| 2025 | $10,203 | $837,033 | $585,928 | $251,105 |
| 2024 | $10,203 | $820,621 | $574,439 | $246,182 |
| 2023 | $9,854 | $804,531 | $563,176 | $241,355 |
| 2022 | $9,704 | $788,756 | $552,133 | $236,623 |
| 2021 | $9,648 | $773,291 | $541,307 | $231,984 |
| 2020 | $9,412 | $765,363 | $535,757 | $229,606 |
| 2019 | $9,137 | $750,356 | $525,252 | $225,104 |
| 2018 | $9,053 | $735,644 | $514,953 | $220,691 |
| 2017 | $8,887 | $721,220 | $504,856 | $216,364 |
| 2016 | $8,362 | $707,079 | $494,957 | $212,122 |
| 2015 | $8,088 | $677,000 | $475,000 | $202,000 |
| 2014 | $7,473 | $652,000 | $457,000 | $195,000 |
Source: Public Records
Map
Nearby Homes
- 310 N Fulton St
- 201 Drown Ave
- 608 E Ojai Ave
- 0 E Ojai Ave Unit 224929
- 0 E Ojai Ave Unit V1-33149
- 211 Fox St
- 312 Fox St
- 1214 Gregory St
- 203 S Montgomery St
- 216 E Aliso St
- 1201 Grand Ave
- 303 Lark Ellen Ave
- 1309 Gregory St
- 207 E Eucalyptus St
- 917 Grandview Ave
- 913 Mountain View Ave
- 910 Mercer Ave
- 0 N Ventura Unit TR25015633
- 102 W Matilija St
- 741 Saddle Ln
Your Personal Tour Guide
Ask me questions while you tour the home.