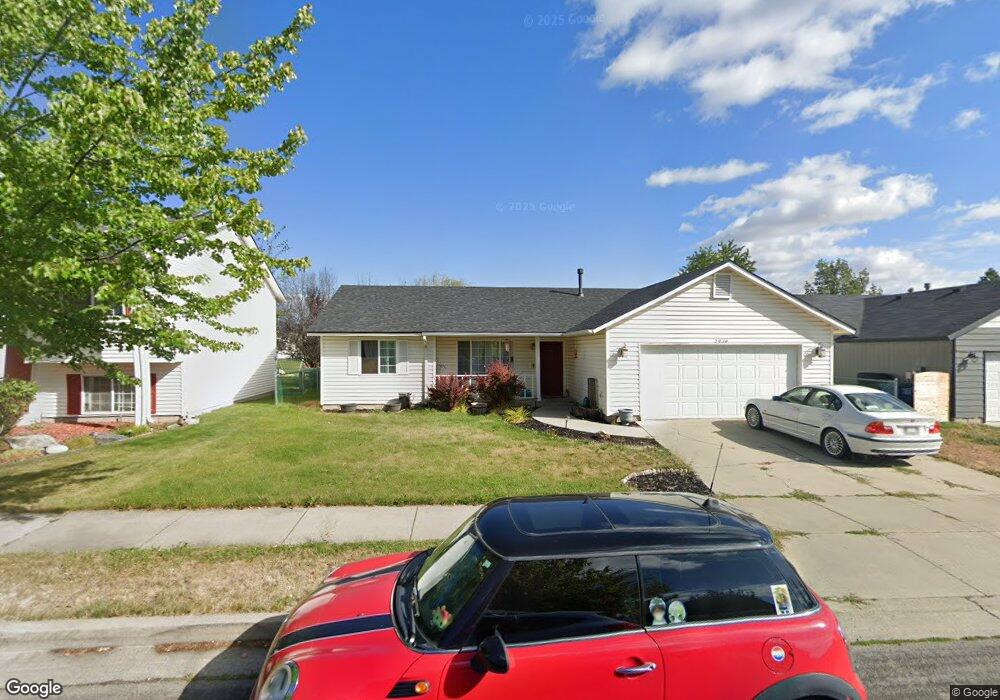
2030 N Quail Run Blvd Post Falls, ID 83854
North Prairie NeighborhoodEstimated Value: $410,961 - $422,000
3
Beds
2
Baths
1,216
Sq Ft
$341/Sq Ft
Est. Value
About This Home
This home is located at 2030 N Quail Run Blvd, Post Falls, ID 83854 and is currently estimated at $414,990, approximately $341 per square foot. 2030 N Quail Run Blvd is a home located in Kootenai County with nearby schools including Prairie View Elementary School, Post Falls Middle School, and Post Falls High School.
Ownership History
Date
Name
Owned For
Owner Type
Purchase Details
Closed on
Jan 9, 2013
Sold by
Harter Rick and Fausett Clifford Lovon
Bought by
Hurley Amber
Current Estimated Value
Home Financials for this Owner
Home Financials are based on the most recent Mortgage that was taken out on this home.
Original Mortgage
$142,900
Outstanding Balance
$104,658
Interest Rate
3.27%
Mortgage Type
USDA
Estimated Equity
$310,332
Purchase Details
Closed on
Jan 8, 2013
Sold by
Kutz Dan
Bought by
Kelley Coleen
Home Financials for this Owner
Home Financials are based on the most recent Mortgage that was taken out on this home.
Original Mortgage
$142,900
Outstanding Balance
$104,658
Interest Rate
3.27%
Mortgage Type
USDA
Estimated Equity
$310,332
Purchase Details
Closed on
Oct 25, 2012
Sold by
Harter Rick
Bought by
Harter Rick and Fausett Clifford Lovon
Purchase Details
Closed on
Apr 11, 2008
Sold by
Vaillancourt Victoria E and Vaillancourt Brian A
Bought by
Lamothe Jason D and Lamothe Christine M
Create a Home Valuation Report for This Property
The Home Valuation Report is an in-depth analysis detailing your home's value as well as a comparison with similar homes in the area
Home Values in the Area
Average Home Value in this Area
Purchase History
| Date | Buyer | Sale Price | Title Company |
|---|---|---|---|
| Hurley Amber | -- | Kootenai County Title | |
| Kelley Coleen | -- | Kootenai Title | |
| Fausett Clifford Lovan | -- | Kootenai County Title Compan | |
| Harter Rick | -- | Kootenai County Title | |
| Harter Rick | -- | Alliance Title | |
| Lamothe Jason D | -- | -- |
Source: Public Records
Mortgage History
| Date | Status | Borrower | Loan Amount |
|---|---|---|---|
| Open | Hurley Amber | $142,900 |
Source: Public Records
Tax History
| Year | Tax Paid | Tax Assessment Tax Assessment Total Assessment is a certain percentage of the fair market value that is determined by local assessors to be the total taxable value of land and additions on the property. | Land | Improvement |
|---|---|---|---|---|
| 2025 | $1,440 | $387,320 | $165,000 | $222,320 |
| 2024 | $1,433 | $377,680 | $155,250 | $222,430 |
| 2023 | $1,433 | $394,930 | $172,500 | $222,430 |
| 2022 | $1,924 | $432,744 | $172,500 | $260,244 |
| 2021 | $1,607 | $280,020 | $115,000 | $165,020 |
| 2020 | $1,357 | $214,620 | $90,000 | $124,620 |
| 2019 | $1,340 | $202,120 | $85,000 | $117,120 |
| 2018 | $1,311 | $180,820 | $74,000 | $106,820 |
| 2017 | $1,227 | $154,290 | $50,000 | $104,290 |
| 2016 | $1,195 | $141,960 | $42,000 | $99,960 |
| 2015 | $1,116 | $129,620 | $34,000 | $95,620 |
| 2013 | $1,086 | $116,670 | $31,500 | $85,170 |
Source: Public Records
Map
Nearby Homes
- 910 E Shasta Ave
- 906 E Glacier Peak Dr
- 2489 N Side Saddle Ln
- 2325 N Mackenzie Dr
- 1700 N Summer Hills Ct
- 2533 N Side Saddle Ln
- 561 E Sand Wedge Dr
- 2815 N Sand Trap Way
- 1545 E Legion St
- 2227 N Chaffee St
- 2238 N Chaffee St
- 2441 N Henry St
- 1552 N McKelvy Ln
- 1544 N McKelvy Ln
- 2815 N Slice Dr
- 987 E Healy Ave
- 1570 N McKelvy Ln
- 1490 N McKelvy Ln
- 1512 N McKelvy Ln
- 1004 E Healy Ave
- 2040 N Quail Run Blvd
- 2020 N Quail Run Blvd
- 2010 N Quail Run Blvd
- 2050 Quail Run Blvd
- 2002 N Cabinet St
- 2002 N Cabinet St
- 2021 Quail Run Blvd
- 2003 N Blossom Ct
- 2031 N Quail Run
- 2031 N Quail Run Blvd
- 2041 Quail Run Blvd
- 2001 Sawtooth Dr
- 2011 Quail Run Blvd
- 2003 N Sawtooth Dr
- 2004 N Cabinet St
- 2004 Cabinet Ct
- 2005 N Blossom Ct
- 2003 Catskill Ct
- 2051 N Quail Run
- 2005 Catskill Ct
Your Personal Tour Guide
Ask me questions while you tour the home.