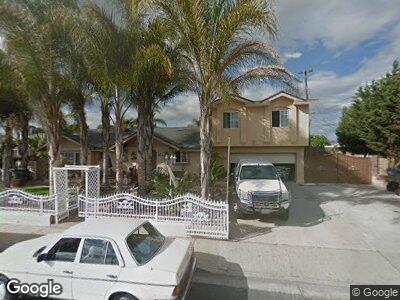
2031 Geneva Way Oxnard, CA 93035
Marina West NeighborhoodEstimated Value: $679,000 - $811,000
5
Beds
3
Baths
1,074
Sq Ft
$704/Sq Ft
Est. Value
About This Home
This home is located at 2031 Geneva Way, Oxnard, CA 93035 and is currently estimated at $755,733, approximately $703 per square foot. 2031 Geneva Way is a home located in Ventura County with nearby schools including Marina West Elementary School, Oxnard High School, and Santa Clara High School.
Ownership History
Date
Name
Owned For
Owner Type
Purchase Details
Closed on
Dec 5, 2023
Sold by
Garcia Sergio and Garcia Soledad
Bought by
Sergio Garcia & Garcia Soledad Garcia Revocab and Garcia
Current Estimated Value
Purchase Details
Closed on
Mar 6, 1998
Sold by
Lepez Jose and Lepez Ana Maria
Bought by
Garcia Sergio and Garcia Soledad
Home Financials for this Owner
Home Financials are based on the most recent Mortgage that was taken out on this home.
Original Mortgage
$100,800
Interest Rate
7.18%
Purchase Details
Closed on
Nov 6, 1995
Sold by
Richard Todd A and Richard Margaret A
Bought by
Lepez Jose Luis and Lepez Ana Maria
Home Financials for this Owner
Home Financials are based on the most recent Mortgage that was taken out on this home.
Original Mortgage
$140,798
Interest Rate
6.98%
Mortgage Type
FHA
Create a Home Valuation Report for This Property
The Home Valuation Report is an in-depth analysis detailing your home's value as well as a comparison with similar homes in the area
Home Values in the Area
Average Home Value in this Area
Purchase History
| Date | Buyer | Sale Price | Title Company |
|---|---|---|---|
| Sergio Garcia & Garcia Soledad Garcia Revocab | -- | None Listed On Document | |
| Garcia Sergio | $126,000 | Fidelity National Title | |
| Lepez Jose Luis | $143,000 | First American Title Ins Co |
Source: Public Records
Mortgage History
| Date | Status | Borrower | Loan Amount |
|---|---|---|---|
| Previous Owner | Garcia Sergio | $123,451 | |
| Previous Owner | Garcia Sergio | $100,800 | |
| Previous Owner | Lepez Jose Luis | $140,798 |
Source: Public Records
Tax History Compared to Growth
Tax History
| Year | Tax Paid | Tax Assessment Tax Assessment Total Assessment is a certain percentage of the fair market value that is determined by local assessors to be the total taxable value of land and additions on the property. | Land | Improvement |
|---|---|---|---|---|
| 2024 | $3,185 | $262,022 | $78,879 | $183,143 |
| 2023 | $3,068 | $256,885 | $77,333 | $179,552 |
| 2022 | $2,975 | $251,849 | $75,817 | $176,032 |
| 2021 | $2,950 | $246,911 | $74,330 | $172,581 |
| 2020 | $3,003 | $244,381 | $73,569 | $170,812 |
| 2019 | $2,917 | $239,590 | $72,127 | $167,463 |
| 2018 | $2,875 | $234,893 | $70,713 | $164,180 |
| 2017 | $2,728 | $230,288 | $69,327 | $160,961 |
| 2016 | $2,632 | $225,773 | $67,968 | $157,805 |
| 2015 | $2,658 | $222,384 | $66,948 | $155,436 |
| 2014 | $2,628 | $218,031 | $65,638 | $152,393 |
Source: Public Records
Map
Nearby Homes
- 203 E Garden Green
- 66 W Garden Green
- 1430 Alturas St
- 1711 Rialto St
- 165 W Fiesta Green
- 73 W Elfin Green
- 167 E Bay Blvd
- 285 E Fiesta Green
- 2112 Miramar Walk
- 1438 W Guava St
- 2723 Bolker Way
- 334 E Elfin Green
- 2545 Neptune Place
- 162 W Alta Green
- 2538 Bolker Dr
- 2526 Bolker Dr
- 205 W Channel Islands Blvd
- 1431 Casa San Carlos Ln Unit B
- 1431 Casa San Carlos Ln Unit A
- 1306 W Hemlock St
- 2031 Geneva Way
- 1800 Woodland St
- 2001 Geneva Way
- 1801 Visalia St
- 1730 Woodland St
- 2030 Geneva Way
- 2020 Geneva Way
- 1731 Visalia St
- 2101 Geneva Way
- 2100 Geneva Way
- 1801 Woodland St
- 2010 Geneva Way
- 1720 Woodland St
- 1731 Woodland St
- 1721 Visalia St
- 2110 Geneva Way
- 2000 Geneva Way
- 1710 Woodland St
- 1721 Woodland St
- 2031 W Hemlock St