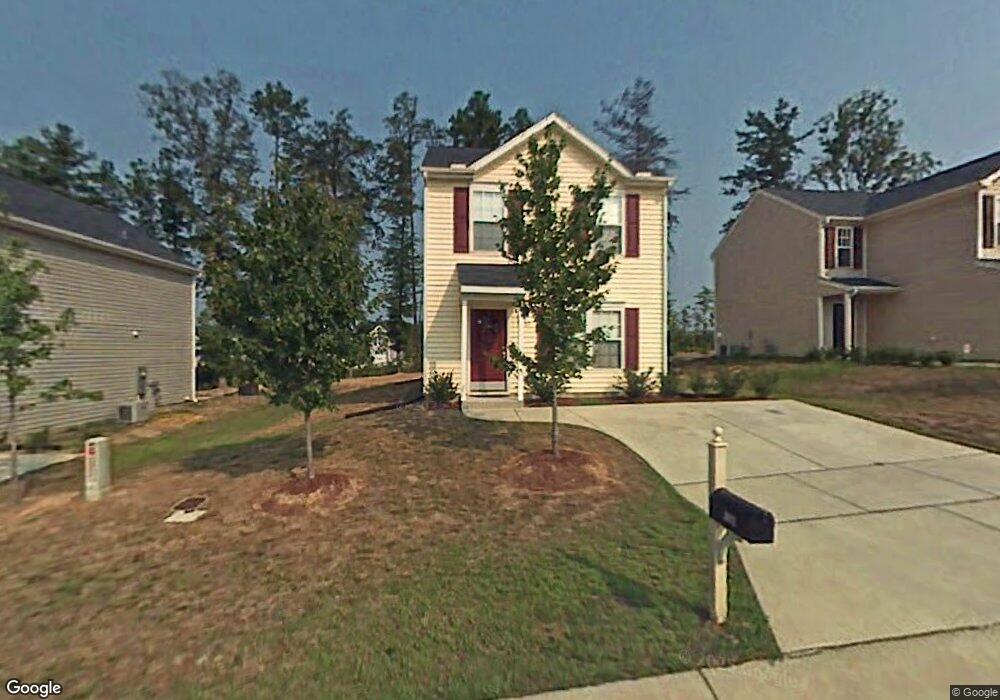
2031 Lime St Durham, NC 27704
Northeast Durham NeighborhoodEstimated Value: $296,681 - $308,000
3
Beds
3
Baths
1,360
Sq Ft
$223/Sq Ft
Est. Value
About This Home
This home is located at 2031 Lime St, Durham, NC 27704 and is currently estimated at $302,920, approximately $222 per square foot. 2031 Lime St is a home located in Durham County with nearby schools including Merrick-Moore Elementary School, John W Neal Middle School, and Southern School of Energy & Sustainability.
Ownership History
Date
Name
Owned For
Owner Type
Purchase Details
Closed on
Jul 21, 2008
Sold by
Bank Of New York
Bought by
Murray Dana Scott
Current Estimated Value
Home Financials for this Owner
Home Financials are based on the most recent Mortgage that was taken out on this home.
Original Mortgage
$79,200
Outstanding Balance
$51,866
Interest Rate
6.37%
Mortgage Type
Purchase Money Mortgage
Estimated Equity
$251,054
Purchase Details
Closed on
Mar 13, 2008
Sold by
Oates Theola
Bought by
Bank Of New York and The Certificateholders Cwabs Inc Asset B
Purchase Details
Closed on
Sep 29, 2004
Sold by
Anderson Homes Inc
Bought by
Oates Theola
Home Financials for this Owner
Home Financials are based on the most recent Mortgage that was taken out on this home.
Original Mortgage
$96,000
Interest Rate
7.5%
Mortgage Type
New Conventional
Purchase Details
Closed on
May 28, 2004
Sold by
East Geer Ventures Llc
Bought by
Anderson Homes Inc
Create a Home Valuation Report for This Property
The Home Valuation Report is an in-depth analysis detailing your home's value as well as a comparison with similar homes in the area
Home Values in the Area
Average Home Value in this Area
Purchase History
| Date | Buyer | Sale Price | Title Company |
|---|---|---|---|
| Murray Dana Scott | $99,000 | None Available | |
| Bank Of New York | $100,800 | None Available | |
| Oates Theola | $120,000 | -- | |
| Anderson Homes Inc | $141,000 | -- |
Source: Public Records
Mortgage History
| Date | Status | Borrower | Loan Amount |
|---|---|---|---|
| Open | Murray Dana Scott | $79,200 | |
| Previous Owner | Oates Theola | $96,000 | |
| Closed | Oates Theola | $24,000 |
Source: Public Records
Tax History
| Year | Tax Paid | Tax Assessment Tax Assessment Total Assessment is a certain percentage of the fair market value that is determined by local assessors to be the total taxable value of land and additions on the property. | Land | Improvement |
|---|---|---|---|---|
| 2025 | $2,788 | $281,242 | $70,625 | $210,617 |
| 2024 | $1,800 | $129,074 | $22,620 | $106,454 |
| 2023 | $1,691 | $129,074 | $22,620 | $106,454 |
| 2022 | $1,652 | $129,074 | $22,620 | $106,454 |
| 2021 | $1,644 | $129,074 | $22,620 | $106,454 |
| 2020 | $1,606 | $129,074 | $22,620 | $106,454 |
| 2019 | $1,606 | $129,074 | $22,620 | $106,454 |
| 2018 | $1,537 | $113,332 | $25,447 | $87,885 |
| 2017 | $1,526 | $113,332 | $25,447 | $87,885 |
| 2016 | $1,475 | $113,332 | $25,447 | $87,885 |
| 2015 | $1,801 | $130,099 | $25,400 | $104,699 |
| 2014 | $1,801 | $130,099 | $25,400 | $104,699 |
Source: Public Records
Map
Nearby Homes
- 2027 Buffalo Way
- 2304 Crestwood Ridge Dr
- 2300 Crestwood Ridge Dr
- 1905 Milan St
- 2040 Feather Rock Dr
- 2206 E Club Blvd
- 2129 Crestwood Ridge Dr
- 18 Syracuse Place
- 2112 Crestwood Ridge Dr
- 1832 E Geer St
- 1515 Milan St
- 2632 Melrose Ave
- 3101 Peale Ln
- 2408 Winburn Ave
- 2406 Winburn Ave
- 1100 Merlin St
- 1012 Merlin St
- 1010 Merlin St
- 1008 Merlin St
- 1009 Merlin St
- 2033 Lime St
- 2029 Lime St
- 1622 Great Bend Dr
- 2027 Lime St
- 2101 Lime St
- 1620 Great Bend Dr
- 1624 Great Bend Dr
- 1618 Great Bend Dr
- 2025 Lime St
- 2030 Lime St
- 2103 Lime St
- 2032 Lime St
- 2028 Lime St
- 1702 Great Bend Dr
- 2026 Lime St
- 201 Great Bend Dr
- 1616 Great Bend Dr
- 2023 Lime St
- 2105 Lime St
- 2104 Lime St
Your Personal Tour Guide
Ask me questions while you tour the home.