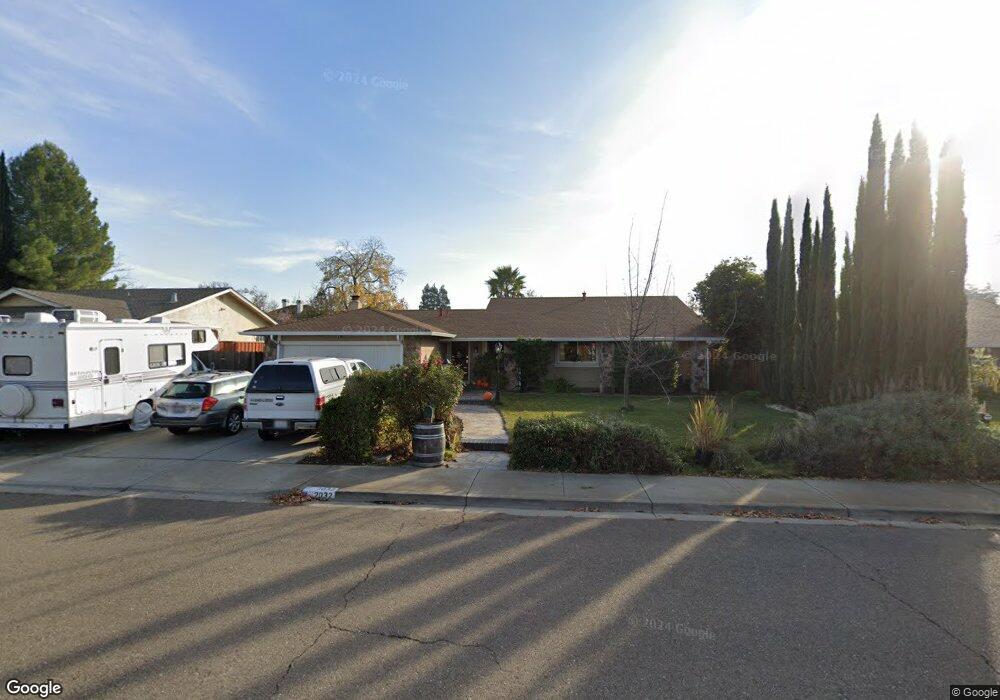
2032 Helsinki Way Livermore, CA 94550
Sunset East NeighborhoodEstimated Value: $1,264,000 - $1,372,000
3
Beds
2
Baths
1,636
Sq Ft
$799/Sq Ft
Est. Value
About This Home
This home is located at 2032 Helsinki Way, Livermore, CA 94550 and is currently estimated at $1,306,723, approximately $798 per square foot. 2032 Helsinki Way is a home located in Alameda County with nearby schools including William Mendenhall Middle School, Granada High School, and Our Savior Lutheran.
Ownership History
Date
Name
Owned For
Owner Type
Purchase Details
Closed on
Aug 3, 2010
Sold by
Niles Angela and Drobshoff Alexander
Bought by
Niles Angela and Drobshoff Alexander
Current Estimated Value
Home Financials for this Owner
Home Financials are based on the most recent Mortgage that was taken out on this home.
Original Mortgage
$389,000
Outstanding Balance
$258,593
Interest Rate
4.65%
Mortgage Type
New Conventional
Estimated Equity
$1,048,130
Purchase Details
Closed on
Feb 18, 2000
Sold by
Niles Angela M
Bought by
Niles Angela M and Drobshoff Alexander D
Home Financials for this Owner
Home Financials are based on the most recent Mortgage that was taken out on this home.
Original Mortgage
$235,000
Interest Rate
7.12%
Purchase Details
Closed on
Feb 25, 1999
Sold by
Cain William E and Cain Frieda A
Bought by
Niles Angela M
Home Financials for this Owner
Home Financials are based on the most recent Mortgage that was taken out on this home.
Original Mortgage
$225,600
Interest Rate
6.76%
Mortgage Type
Stand Alone First
Create a Home Valuation Report for This Property
The Home Valuation Report is an in-depth analysis detailing your home's value as well as a comparison with similar homes in the area
Home Values in the Area
Average Home Value in this Area
Purchase History
| Date | Buyer | Sale Price | Title Company |
|---|---|---|---|
| Niles Angela | -- | First American Title Company | |
| Niles Angela M | -- | Fidelity National Title Co | |
| Niles Angela M | $282,000 | Fidelity National Title Ins |
Source: Public Records
Mortgage History
| Date | Status | Borrower | Loan Amount |
|---|---|---|---|
| Open | Niles Angela | $389,000 | |
| Closed | Niles Angela M | $235,000 | |
| Previous Owner | Niles Angela M | $225,600 |
Source: Public Records
Tax History
| Year | Tax Paid | Tax Assessment Tax Assessment Total Assessment is a certain percentage of the fair market value that is determined by local assessors to be the total taxable value of land and additions on the property. | Land | Improvement |
|---|---|---|---|---|
| 2025 | $5,987 | $435,068 | $132,620 | $309,448 |
| 2024 | $5,987 | $426,402 | $130,020 | $303,382 |
| 2023 | $5,887 | $424,905 | $127,471 | $297,434 |
| 2022 | $5,792 | $409,575 | $124,972 | $291,603 |
| 2021 | $4,924 | $401,408 | $122,522 | $285,886 |
| 2020 | $5,493 | $404,221 | $121,266 | $282,955 |
| 2019 | $5,508 | $396,297 | $118,889 | $277,408 |
| 2018 | $5,380 | $388,527 | $116,558 | $271,969 |
| 2017 | $5,235 | $380,911 | $114,273 | $266,638 |
| 2016 | $5,030 | $373,443 | $112,033 | $261,410 |
| 2015 | $4,725 | $367,834 | $110,350 | $257,484 |
| 2014 | $4,640 | $360,630 | $108,189 | $252,441 |
Source: Public Records
Map
Nearby Homes
- 2191 Kara Place
- 2373 Alsace Ct
- 1500 Arroyo Rd
- 1835 Cairo St
- 1166 Killarney St
- 1349 Evans Place
- 2680 Marina Ave
- 2772 San Minete Dr
- 2221 Leccino Ct
- 1223 Aberdeen Ave
- 1059 Catalina Dr
- 2290 Chateau Way
- 1556 Wagoner Dr
- 1185 El Dorado Dr
- 2633 Regent Rd
- 874 Mendenhall Dr
- 2170 Santa Croce Dr
- 2211 College Ave
- 1766 College Ave
- 2342 Palm Ave
- 2048 Helsinki Way
- 2014 Helsinki Way
- 2056 Helsinki Way
- 2043 Helsinki Way
- 2000 Helsinki Way
- 2057 Helsinki Way
- 2009 Helsinki Way
- 1834 Sterling Place
- 2061 Helsinki Way
- 1848 Sterling Place
- 2064 Helsinki Way
- 1992 Helsinki Way
- 1973 Helsinki Way
- 2059 Heidelberg Ct
- 1812 Sterling Place
- 1984 Helsinki Way
- 1860 Sterling Place
- 1759 Heidelberg Dr
- 1783 Heidelberg Dr
- 1976 Helsinki Way
Your Personal Tour Guide
Ask me questions while you tour the home.