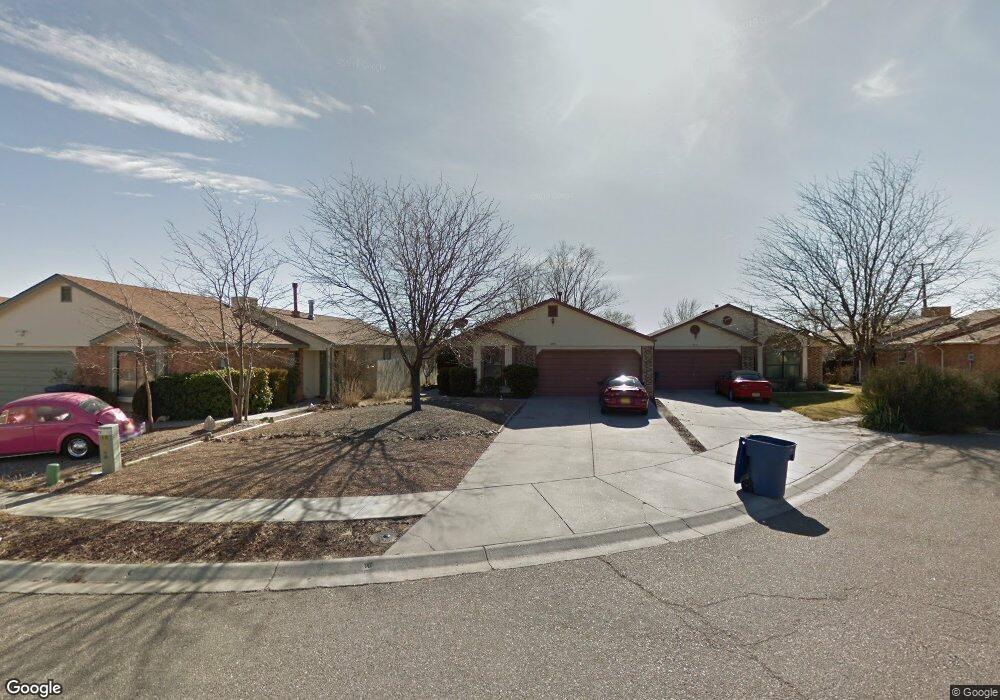
2033 Castillo Dr SW Los Lunas, NM 87031
Estimated Value: $229,000 - $257,000
3
Beds
2
Baths
1,184
Sq Ft
$207/Sq Ft
Est. Value
About This Home
This home is located at 2033 Castillo Dr SW, Los Lunas, NM 87031 and is currently estimated at $245,121, approximately $207 per square foot. 2033 Castillo Dr SW is a home located in Valencia County with nearby schools including Katherine Gallegos Elementary School, Los Lunas Middle School, and Los Lunas High School.
Ownership History
Date
Name
Owned For
Owner Type
Purchase Details
Closed on
Jul 24, 2020
Sold by
Maya David T
Bought by
Maya Dorothy J
Current Estimated Value
Purchase Details
Closed on
Aug 19, 2019
Sold by
Vigil Denise and Romero Denise
Bought by
Maya David T
Home Financials for this Owner
Home Financials are based on the most recent Mortgage that was taken out on this home.
Original Mortgage
$108,694
Outstanding Balance
$95,196
Interest Rate
3.7%
Mortgage Type
FHA
Estimated Equity
$149,925
Purchase Details
Closed on
Jun 8, 2009
Sold by
Sparkes Kathleen E
Bought by
Romero Denise
Home Financials for this Owner
Home Financials are based on the most recent Mortgage that was taken out on this home.
Original Mortgage
$120,408
Interest Rate
4.7%
Mortgage Type
New Conventional
Purchase Details
Closed on
Feb 19, 2009
Sold by
Sparkes Kathleen E
Bought by
Sparkes Kathleen E
Create a Home Valuation Report for This Property
The Home Valuation Report is an in-depth analysis detailing your home's value as well as a comparison with similar homes in the area
Home Values in the Area
Average Home Value in this Area
Purchase History
| Date | Buyer | Sale Price | Title Company |
|---|---|---|---|
| Maya Dorothy J | -- | None Available | |
| Maya David T | -- | Fidelity National Ttl Ins Co | |
| Maya David T | -- | Fidelity National Ttl Ins Co | |
| Vigil Denise | -- | Fidelity National Ttl Ins Co | |
| Romero Denise | -- | -- | |
| Sparkes Kathleen E | -- | -- |
Source: Public Records
Mortgage History
| Date | Status | Borrower | Loan Amount |
|---|---|---|---|
| Open | Maya David T | $108,694 | |
| Previous Owner | Romero Denise | $120,408 |
Source: Public Records
Tax History Compared to Growth
Tax History
| Year | Tax Paid | Tax Assessment Tax Assessment Total Assessment is a certain percentage of the fair market value that is determined by local assessors to be the total taxable value of land and additions on the property. | Land | Improvement |
|---|---|---|---|---|
| 2024 | $1,335 | $40,322 | $6,667 | $33,655 |
| 2023 | $1,288 | $39,147 | $6,667 | $32,480 |
| 2022 | $1,267 | $38,007 | $6,867 | $31,140 |
| 2021 | $1,278 | $38,007 | $6,867 | $31,140 |
| 2020 | $1,265 | $36,900 | $6,667 | $30,233 |
| 2019 | $1,624 | $47,104 | $9,834 | $37,270 |
| 2018 | $1,595 | $47,104 | $9,834 | $37,270 |
| 2017 | $1,545 | $46,326 | $9,834 | $36,492 |
| 2016 | $1,502 | $44,977 | $9,834 | $35,143 |
| 2015 | -- | $43,667 | $9,834 | $33,833 |
| 2013 | -- | $41,161 | $9,834 | $31,327 |
| 2011 | -- | $119,889 | $28,644 | $91,245 |
Source: Public Records
Map
Nearby Homes
- 1034 Wagon Trail St
- 1050 Wagon Trail St SW
- 823 Corral St SW
- 2258 Calle de Ortiz SW
- 2260 Calle de Alifas SW
- 2260 Firewheel Ave SW
- 1628 Drake Rd
- 2512 Red Sky SW
- 960 Firewheel Loop SW
- 2601 Scarlet Sage Rd SW
- 00 New Mexico 6
- 711 Firewheel Loop SW
- 2248 Calle de Silverio
- 660 Primrose Ave SW
- 750 Fire Wheel Loop
- 0 Drake Rd
- 1107 Valley View Dr SW
- 2670 Scarlet Sage St SW
- 1330 Crestview Dr SW
- 1864 Villa Contesa Loop NW
- 2025 Castillo Dr SW
- 2041 Castillo Dr SW
- 2025 Castillo Ct SW
- 2049 Castillo Ct SW
- 2017 Castillo Dr SW
- 2049 Castillo Dr SW
- 2009 Castillo Dr SW
- 863 Camino Del Rey Ct SW
- 2032 Castillo Ct SW
- 2048 Castillo Ct SW
- 2032 Castillo Dr SW
- 2001 Castillo Dr SW
- 2040 Castillo Dr SW
- 2024 Castillo Dr SW
- 2048 Castillo Dr SW
- 2016 Castillo Dr SW
- 2000 Castillo Ct SW
- 2008 Castillo Ct SW
- 2008 Castillo Dr SW
- 2000 Castillo Dr SW