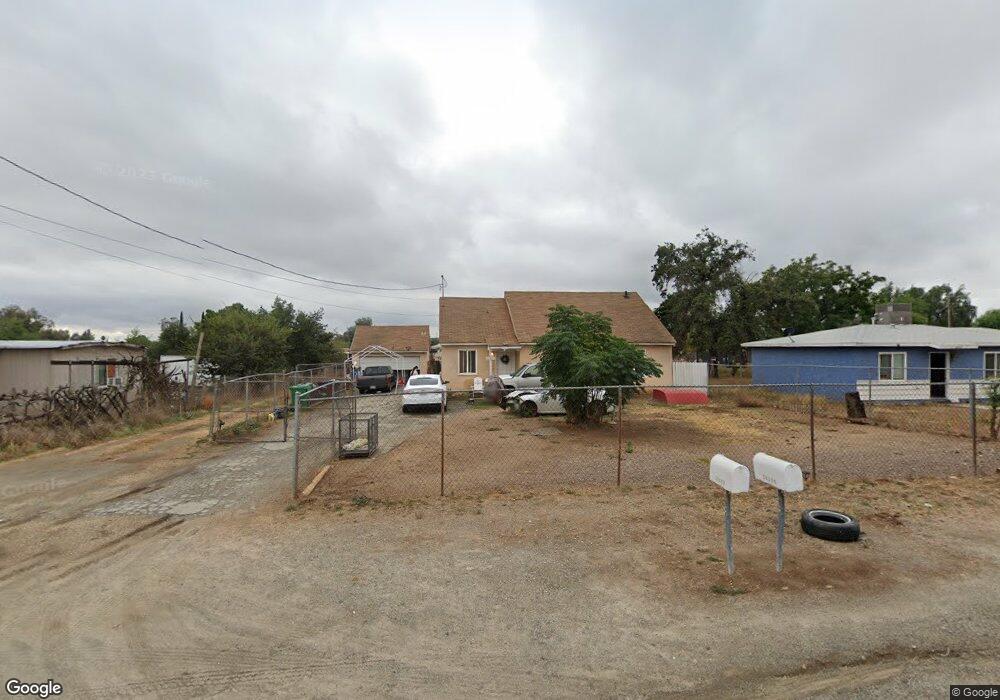
20339 Jefferson St Perris, CA 92570
Estimated Value: $453,000 - $488,000
3
Beds
2
Baths
1,250
Sq Ft
$374/Sq Ft
Est. Value
About This Home
This home is located at 20339 Jefferson St, Perris, CA 92570 and is currently estimated at $467,185, approximately $373 per square foot. 20339 Jefferson St is a home located in Riverside County with nearby schools including Mead Valley Elementary School, Tomas Rivera Middle School, and Citrus Hill High School.
Ownership History
Date
Name
Owned For
Owner Type
Purchase Details
Closed on
Jun 20, 2025
Sold by
Rye Terry
Bought by
Cuen Victor and Cuen Denise
Current Estimated Value
Home Financials for this Owner
Home Financials are based on the most recent Mortgage that was taken out on this home.
Original Mortgage
$315,000
Interest Rate
6.77%
Mortgage Type
New Conventional
Purchase Details
Closed on
Apr 4, 2011
Sold by
Rye Lisa
Bought by
Rye Terry
Purchase Details
Closed on
Mar 28, 2011
Sold by
Federal National Mortgage Association
Bought by
Rye Terry
Purchase Details
Closed on
Aug 4, 2010
Sold by
Robinson Vera
Bought by
Federal National Mortgage Association
Purchase Details
Closed on
Jul 9, 2005
Sold by
Robinson Vera
Bought by
Robinson Vera and Vera Robinson Living Trust
Purchase Details
Closed on
Dec 21, 1998
Sold by
Robinson Vera
Bought by
Bank Of America National Tr & Svgs Assn
Create a Home Valuation Report for This Property
The Home Valuation Report is an in-depth analysis detailing your home's value as well as a comparison with similar homes in the area
Home Values in the Area
Average Home Value in this Area
Purchase History
| Date | Buyer | Sale Price | Title Company |
|---|---|---|---|
| Cuen Victor | $450,000 | Ticor Title Company | |
| Rye Terry | -- | Lsi Title Company Ca | |
| Rye Terry | $72,000 | Lsi Title Company Ca | |
| Federal National Mortgage Association | $121,891 | None Available | |
| Robinson Vera | -- | -- | |
| Bank Of America National Tr & Svgs Assn | $56,000 | Chicago Title Co |
Source: Public Records
Mortgage History
| Date | Status | Borrower | Loan Amount |
|---|---|---|---|
| Previous Owner | Cuen Victor | $315,000 |
Source: Public Records
Tax History
| Year | Tax Paid | Tax Assessment Tax Assessment Total Assessment is a certain percentage of the fair market value that is determined by local assessors to be the total taxable value of land and additions on the property. | Land | Improvement |
|---|---|---|---|---|
| 2025 | $1,034 | $92,226 | $51,239 | $40,987 |
| 2023 | $1,034 | $88,647 | $49,250 | $39,397 |
| 2022 | $1,004 | $86,910 | $48,285 | $38,625 |
| 2021 | $985 | $85,207 | $47,339 | $37,868 |
| 2020 | $975 | $84,334 | $46,854 | $37,480 |
| 2019 | $916 | $82,682 | $45,936 | $36,746 |
| 2018 | $904 | $81,062 | $45,036 | $36,026 |
| 2017 | $883 | $79,473 | $44,153 | $35,320 |
| 2016 | $873 | $77,916 | $43,288 | $34,628 |
| 2015 | $860 | $76,748 | $42,639 | $34,109 |
| 2014 | $850 | $75,246 | $41,804 | $33,442 |
Source: Public Records
Map
Nearby Homes
- 20701 Costello Ave
- 17900 Nandina Ave
- 20398 Bailly St
- 18251 Northstar Ave
- 20646 Markham St
- 0 Ryan St
- 9549 Calico Trail
- 19975 Heartwood Dr
- 18740 Cable Ln
- 19430 Nalancia Way
- 9618 Babaco St
- 9610 Babaco St
- 19380 Nalancia Way
- 9619 Babaco St
- 9611 Babaco St
- 19124 Glenwood Ave
- 19095 Glenwood Ave
- 9667 Salamanca St
- 19100 Markham St
- 19105 Laurelhurst Ave
- 20321 Jefferson St
- 20343 Jefferson St
- 20320 Jefferson St
- 20295 Jefferson St
- 20282 Jefferson St
- 20344 Jefferson St
- 17649 Poquito Ln
- 17663 Poquito Ln
- 17691 Traxler Ln
- 20354 Warren Rd
- 20263 Jefferson St
- 17701 Traxler Ln
- 17678 Elizabeth St
- 20262 Jefferson St
- 17715 Traxler Ln
- 20322 Warren Rd
- 20320 Warren Rd
- 20441 Jefferson St
- 17688 Poquito Ln
- 20378 Warren Rd
Your Personal Tour Guide
Ask me questions while you tour the home.