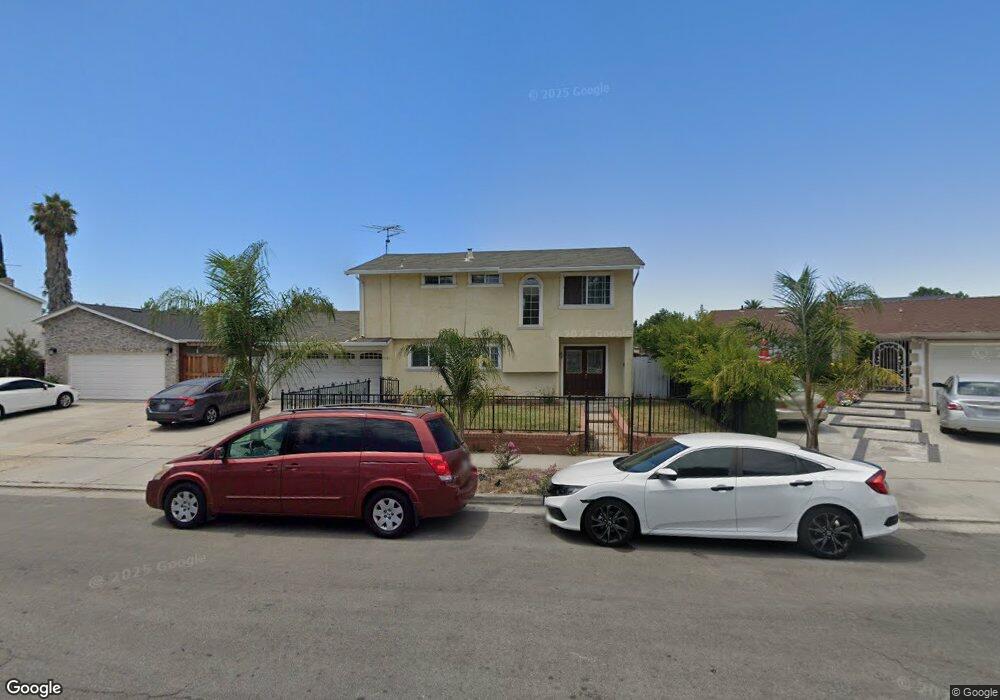
2035 Starfish Ct San Jose, CA 95148
Estimated Value: $1,213,000 - $1,391,000
4
Beds
3
Baths
1,582
Sq Ft
$819/Sq Ft
Est. Value
About This Home
This home is located at 2035 Starfish Ct, San Jose, CA 95148 and is currently estimated at $1,296,012, approximately $819 per square foot. 2035 Starfish Ct is a home located in Santa Clara County with nearby schools including Thomas P. Ryan Elementary School, Ocala Middle School, and Mt. Pleasant High School.
Ownership History
Date
Name
Owned For
Owner Type
Purchase Details
Closed on
Jun 23, 2014
Sold by
Kaur Surinder
Bought by
The S & S Bains Family Trust and Kaur Surinder
Current Estimated Value
Purchase Details
Closed on
Nov 7, 2002
Sold by
Singh Bara and Kaur Surinder
Bought by
Singh Bara
Home Financials for this Owner
Home Financials are based on the most recent Mortgage that was taken out on this home.
Original Mortgage
$98,000
Interest Rate
5.95%
Purchase Details
Closed on
Dec 1, 1998
Sold by
Bains Jaswinder Singh and Bains Lakhvir
Bought by
Singh Bara
Purchase Details
Closed on
Jan 3, 1997
Sold by
Domondon Felix G and Domondon Marieta A
Bought by
Bains Jaswinder Singh and Bains Lakhvin
Home Financials for this Owner
Home Financials are based on the most recent Mortgage that was taken out on this home.
Original Mortgage
$130,000
Interest Rate
7.53%
Create a Home Valuation Report for This Property
The Home Valuation Report is an in-depth analysis detailing your home's value as well as a comparison with similar homes in the area
Home Values in the Area
Average Home Value in this Area
Purchase History
| Date | Buyer | Sale Price | Title Company |
|---|---|---|---|
| The S & S Bains Family Trust | -- | None Available | |
| Singh Bara | -- | Financial Title Company | |
| Singh Bara | -- | -- | |
| Bains Jaswinder Singh | $205,000 | Santa Clara Land Title Co |
Source: Public Records
Mortgage History
| Date | Status | Borrower | Loan Amount |
|---|---|---|---|
| Previous Owner | Singh Bara | $98,000 | |
| Previous Owner | Bains Jaswinder Singh | $130,000 |
Source: Public Records
Tax History Compared to Growth
Tax History
| Year | Tax Paid | Tax Assessment Tax Assessment Total Assessment is a certain percentage of the fair market value that is determined by local assessors to be the total taxable value of land and additions on the property. | Land | Improvement |
|---|---|---|---|---|
| 2025 | $6,065 | $350,140 | $130,282 | $219,858 |
| 2024 | $6,065 | $343,276 | $127,728 | $215,548 |
| 2023 | $5,922 | $336,546 | $125,224 | $211,322 |
| 2022 | $5,809 | $329,948 | $122,769 | $207,179 |
| 2021 | $5,591 | $323,479 | $120,362 | $203,117 |
| 2020 | $5,456 | $320,163 | $119,128 | $201,035 |
| 2019 | $5,297 | $313,887 | $116,793 | $197,094 |
| 2018 | $5,216 | $307,733 | $114,503 | $193,230 |
| 2017 | $5,217 | $301,700 | $112,258 | $189,442 |
| 2016 | $4,927 | $295,785 | $110,057 | $185,728 |
| 2015 | $4,911 | $291,343 | $108,404 | $182,939 |
| 2014 | $4,433 | $285,637 | $106,281 | $179,356 |
Source: Public Records
Map
Nearby Homes
- 2195 Cunningham Ct
- 1837 S White Rd
- 3144 Coldwater Dr
- 3156 Coldwater Dr
- 3146 Marten Ave
- 2017 Flintbury Ct
- 3250 Sylvan Dr
- 1860 Home Gate Dr
- 1812 Home Gate Dr
- 1651 Estates Ct
- 1701 S Capitol Ave
- 1702 Mount Rushmore Dr
- 3440 Rubion Dr
- 3286 Dias Dr
- 2209 Fairmont Dr
- 2493 Alfred Way
- 2277 Flint Ave
- 10281 Murtha Dr
- 3416 Mount Mckinley Ct
- 2467 Flint Ave
- 2039 Starfish Ct
- 2031 Starfish Ct
- 2038 Cove Ct
- 2043 Starfish Ct
- 3026 Moonstar Ct
- 2027 Starfish Ct
- 2042 Cove Ct
- 3030 Moonstar Ct
- 3022 Moonstar Ct
- 2036 Starfish Ct
- 2030 Cove Ct
- 2047 Starfish Ct
- 2024 Starfish Ct
- 2040 Starfish Ct
- 2046 Cove Ct
- 3051 Cunningham Ave
- 2028 Starfish Ct
- 3018 Moonstar Ct
- 3031 Moonstar Ct
- 2033 Cove Ct