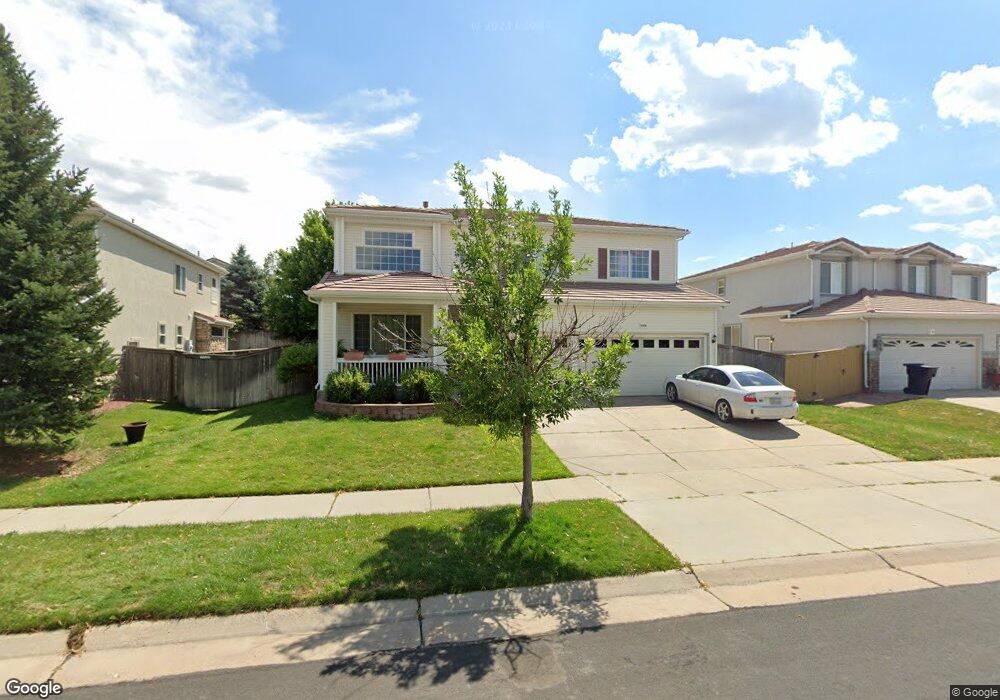
20356 E 49th Ave Denver, CO 80249
Green Valley Ranch NeighborhoodEstimated Value: $584,000 - $642,000
5
Beds
3
Baths
2,835
Sq Ft
$215/Sq Ft
Est. Value
About This Home
This home is located at 20356 E 49th Ave, Denver, CO 80249 and is currently estimated at $610,205, approximately $215 per square foot. 20356 E 49th Ave is a home located in Denver County with nearby schools including Pitt-Waller K-8 School, McGlone Academy, and Marie L. Greenwood Academy.
Ownership History
Date
Name
Owned For
Owner Type
Purchase Details
Closed on
Jun 5, 2020
Sold by
Young Rosalie
Bought by
Mcclendon Savanna and Warfield Manny
Current Estimated Value
Home Financials for this Owner
Home Financials are based on the most recent Mortgage that was taken out on this home.
Original Mortgage
$446,758
Outstanding Balance
$393,279
Interest Rate
3.3%
Mortgage Type
FHA
Estimated Equity
$216,926
Purchase Details
Closed on
Apr 2, 2010
Sold by
Strode Andre G and Strode Karen M
Bought by
Young Rosalie
Home Financials for this Owner
Home Financials are based on the most recent Mortgage that was taken out on this home.
Original Mortgage
$202,268
Interest Rate
5.25%
Mortgage Type
FHA
Purchase Details
Closed on
Aug 21, 2001
Sold by
Oakwood Homes Llc
Bought by
Strode Andre G and Strode Karen M
Home Financials for this Owner
Home Financials are based on the most recent Mortgage that was taken out on this home.
Original Mortgage
$242,000
Interest Rate
6.98%
Create a Home Valuation Report for This Property
The Home Valuation Report is an in-depth analysis detailing your home's value as well as a comparison with similar homes in the area
Home Values in the Area
Average Home Value in this Area
Purchase History
| Date | Buyer | Sale Price | Title Company |
|---|---|---|---|
| Mcclendon Savanna | $455,000 | Chicago Title | |
| Young Rosalie | $206,000 | Wtg | |
| Strode Andre G | $322,284 | Stewart Title | |
| Oakwood Homes Llc | -- | Stewart Title |
Source: Public Records
Mortgage History
| Date | Status | Borrower | Loan Amount |
|---|---|---|---|
| Open | Mcclendon Savanna | $446,758 | |
| Previous Owner | Young Rosalie | $202,268 | |
| Previous Owner | Strode Andre G | $242,000 |
Source: Public Records
Tax History
| Year | Tax Paid | Tax Assessment Tax Assessment Total Assessment is a certain percentage of the fair market value that is determined by local assessors to be the total taxable value of land and additions on the property. | Land | Improvement |
|---|---|---|---|---|
| 2025 | $5,074 | $45,580 | $8,530 | $8,530 |
| 2024 | $5,074 | $39,660 | $4,420 | $35,240 |
| 2023 | $4,884 | $39,660 | $4,420 | $35,240 |
| 2022 | $4,341 | $32,610 | $7,280 | $25,330 |
| 2021 | $4,010 | $33,550 | $7,490 | $26,060 |
| 2020 | $4,274 | $32,250 | $7,490 | $24,760 |
| 2019 | $4,207 | $32,250 | $7,490 | $24,760 |
| 2018 | $3,764 | $27,800 | $4,640 | $23,160 |
| 2017 | $4,670 | $27,800 | $4,640 | $23,160 |
| 2016 | $3,770 | $22,770 | $4,497 | $18,273 |
| 2015 | $3,692 | $22,770 | $4,497 | $18,273 |
| 2014 | $2,891 | $18,290 | $2,388 | $15,902 |
Source: Public Records
Map
Nearby Homes
- 20655 E 49th Ave
- 20708 E 49th Dr
- 20750 E Beekman Place
- 4999 N Yampa St
- 20644 E 47th Ave
- 4839 Liverpool St
- 4868 Halifax Ct
- 20553 E 50th Place
- 20865 E 47th Ave
- 5017 Liverpool St
- 20031 Elgin Dr
- 19037 E 64th Ave
- 20762 E 44th Ave
- 5012 Liverpool St
- 4632 Gibraltar St
- 4886 Gibraltar St
- 4531 Gibraltar St
- 20420 Kelly Place
- 4312 Kirk Ct
- 20423 E 43rd Ave
- 20354 E 49th Ave
- 20364 E 49th Ave
- 20366 E 49th Ave
- 20353 E 48th Place
- 20367 E 49th Ave
- 20375 E 49th Ave
- 20361 E 48th Place
- 20365 E 49th Ave
- 20374 E 49th Ave
- 20363 E 48th Place
- 20377 E 49th Ave
- 20357 E 49th Ave
- 20371 E 48th Place
- 20376 E 49th Ave
- 20355 E 49th Ave
- 20341 E 48th Place
- 20373 E 48th Place
- 20385 E 49th Ave
- 20384 E 49th Ave
- 20387 E 49th Ave
Your Personal Tour Guide
Ask me questions while you tour the home.