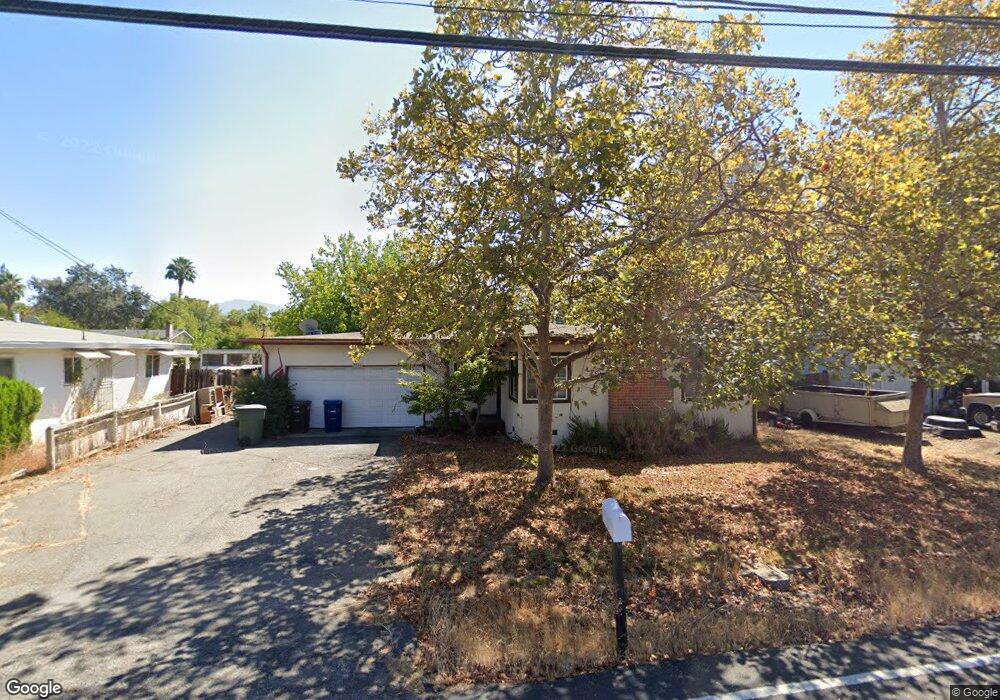
2036 Chalomar Rd Concord, CA 94518
Ygnacio Valley NeighborhoodEstimated Value: $494,000 - $691,000
3
Beds
1
Bath
1,034
Sq Ft
$574/Sq Ft
Est. Value
About This Home
This home is located at 2036 Chalomar Rd, Concord, CA 94518 and is currently estimated at $593,764, approximately $574 per square foot. 2036 Chalomar Rd is a home located in Contra Costa County with nearby schools including Ygnacio Valley Elementary School, Oak Grove Middle School, and Ygnacio Valley High School.
Ownership History
Date
Name
Owned For
Owner Type
Purchase Details
Closed on
Nov 19, 2025
Sold by
Payne-Drake Karen
Bought by
Afonso Justin Joseph and Payne Bailey Nichole
Current Estimated Value
Home Financials for this Owner
Home Financials are based on the most recent Mortgage that was taken out on this home.
Original Mortgage
$350,000
Outstanding Balance
$349,008
Interest Rate
6.3%
Mortgage Type
New Conventional
Estimated Equity
$244,756
Purchase Details
Closed on
Apr 18, 2008
Sold by
Kellogg Kenneth C and Payne Steven H
Bought by
Payne Drake Karen
Home Financials for this Owner
Home Financials are based on the most recent Mortgage that was taken out on this home.
Original Mortgage
$242,100
Interest Rate
5.81%
Mortgage Type
Unknown
Purchase Details
Closed on
Nov 21, 2000
Sold by
Ellen Kellogg and Magnolia Ellen Magnolia
Bought by
Kellogg Kenneth S and Kellogg Ellen M
Purchase Details
Closed on
May 2, 1995
Sold by
Otradovec Sarh E
Bought by
Kellogg Ellen
Purchase Details
Closed on
Mar 14, 1995
Sold by
Bellamy Ellen Magnolia and Otradovec Edward J
Bought by
Kellogg Ellen Magnolia
Purchase Details
Closed on
Feb 15, 1995
Sold by
Otradovec Edward J
Bought by
Otradovec Edward J and Otradovec Sarah E
Create a Home Valuation Report for This Property
The Home Valuation Report is an in-depth analysis detailing your home's value as well as a comparison with similar homes in the area
Home Values in the Area
Average Home Value in this Area
Purchase History
| Date | Buyer | Sale Price | Title Company |
|---|---|---|---|
| Afonso Justin Joseph | $500,000 | Fidelity National Title Compan | |
| Payne Drake Karen | $268,500 | North American Title Company | |
| Kellogg Kenneth S | -- | -- | |
| Kellogg Ellen | -- | -- | |
| Kellogg Ellen Magnolia | -- | -- | |
| Otradovec Edward J | -- | -- |
Source: Public Records
Mortgage History
| Date | Status | Borrower | Loan Amount |
|---|---|---|---|
| Open | Afonso Justin Joseph | $350,000 | |
| Previous Owner | Payne Drake Karen | $242,100 |
Source: Public Records
Tax History
| Year | Tax Paid | Tax Assessment Tax Assessment Total Assessment is a certain percentage of the fair market value that is determined by local assessors to be the total taxable value of land and additions on the property. | Land | Improvement |
|---|---|---|---|---|
| 2025 | $1,791 | $83,579 | $42,127 | $41,452 |
| 2024 | $1,723 | $81,941 | $41,301 | $40,640 |
| 2023 | $1,663 | $80,336 | $40,492 | $39,844 |
| 2022 | $1,612 | $78,762 | $39,699 | $39,063 |
| 2021 | $1,548 | $77,219 | $38,921 | $38,298 |
| 2019 | $1,498 | $74,930 | $37,767 | $37,163 |
| 2018 | $1,492 | $73,462 | $37,027 | $36,435 |
| 2017 | $1,423 | $72,022 | $36,301 | $35,721 |
| 2016 | $1,350 | $70,611 | $35,590 | $35,021 |
| 2015 | $1,296 | $69,551 | $35,056 | $34,495 |
| 2014 | $1,238 | $68,190 | $34,370 | $33,820 |
Source: Public Records
Map
Nearby Homes
- 1941 Woodmoor Ct
- 1035 Heckmann Ln
- 2190 Charlotte Ave
- 1795 Klier Dr
- 1036 Oak Grove Rd Unit 23
- 1036 Oak Grove Rd Unit 86
- 1036 Oak Grove Rd Unit 21
- 2745 Minert Rd
- 2005 Sierra Rd
- 2605 Ryan Rd
- 2055 Sierra Rd Unit 53
- 2045 Sierra Rd Unit 2
- 875 Brittany Ln
- 855 Brittany Ln
- 1060 Oak Grove Rd Unit 37
- 825 Oak Grove Rd Unit 17
- 825 Oak Grove Rd Unit 62
- 810 Oak Grove Rd Unit 104
- 2042 Smith Ln
- 2840 Royal Ann Ln
- 2054 Chalomar Rd
- 2018 Chalomar Rd
- 980 Oak Grove Rd Unit A
- 980 Oak Grove Rd
- 980 Oak Grove Rd
- 978 Oak Grove Rd
- 2000 Chalomar Rd
- 2072 Chalomar Rd
- 982 Oak Grove Rd
- 976 Oak Grove Rd
- 2090 Chalomar Rd
- 2019 Oak Grove Ct
- 984 Oak Grove Rd
- 2037 Oak Grove Ct
- 2001 Oak Grove Ct
- 1964 Keswick Ln
- 963 Chanel Ct
- 965 Chanel Ct
- 2055 Oak Grove Ct
- 961 Chanel Ct
Your Personal Tour Guide
Ask me questions while you tour the home.