Estimated Value: $300,000 - $382,000
3
Beds
1
Bath
972
Sq Ft
$353/Sq Ft
Est. Value
About This Home
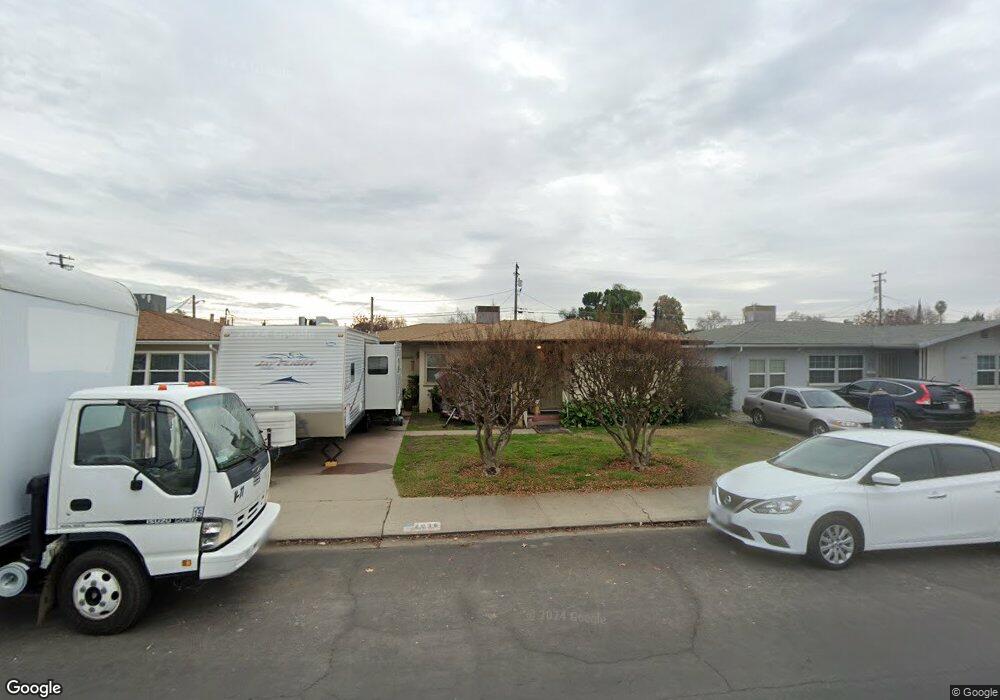
This home is located at 2036 Sequoia St, Ceres, CA 95307 and is currently estimated at $342,662, approximately $352 per square foot. 2036 Sequoia St is a home located in Stanislaus County with nearby schools including Caswell Elementary School, Mae Hensley Junior High School, and Ceres High School.
Ownership History
Date
Name
Owned For
Owner Type
Purchase Details
Closed on
Aug 19, 2010
Sold by
Rangel Henry and Rangel Carol Ann
Bought by
Federal Home Loan Mortgage Corporation
Current Estimated Value
Purchase Details
Closed on
Apr 16, 2009
Sold by
Rangel Carol Ann
Bought by
Revocable Living Trust Of The Rangel Fam
Purchase Details
Closed on
Aug 4, 2004
Sold by
Rangel Henry
Bought by
Rangel Carol Ann
Purchase Details
Closed on
Sep 25, 1998
Sold by
Head Clark
Bought by
Rangel Henry and Rangel Carol Ann
Home Financials for this Owner
Home Financials are based on the most recent Mortgage that was taken out on this home.
Original Mortgage
$68,964
Interest Rate
6.88%
Mortgage Type
FHA
Create a Home Valuation Report for This Property
The Home Valuation Report is an in-depth analysis detailing your home's value as well as a comparison with similar homes in the area
Purchase History
| Date | Buyer | Sale Price | Title Company |
|---|---|---|---|
| Federal Home Loan Mortgage Corporation | $68,161 | Accommodation | |
| Revocable Living Trust Of The Rangel Fam | -- | None Available | |
| Rangel Carol Ann | -- | -- | |
| Rangel Henry | $69,000 | North American Title Co | |
| Head Clark | -- | North American Title Co |
Source: Public Records
Mortgage History
| Date | Status | Borrower | Loan Amount |
|---|---|---|---|
| Previous Owner | Rangel Henry | $68,964 |
Source: Public Records
Tax History
| Year | Tax Paid | Tax Assessment Tax Assessment Total Assessment is a certain percentage of the fair market value that is determined by local assessors to be the total taxable value of land and additions on the property. | Land | Improvement |
|---|---|---|---|---|
| 2025 | $1,188 | $108,150 | $28,207 | $79,943 |
| 2024 | $1,112 | $106,030 | $27,654 | $78,376 |
| 2023 | $1,080 | $103,952 | $27,112 | $76,840 |
| 2022 | $1,070 | $101,915 | $26,581 | $75,334 |
| 2021 | $1,059 | $99,917 | $26,060 | $73,857 |
| 2020 | $1,025 | $98,893 | $25,793 | $73,100 |
| 2019 | $1,017 | $96,955 | $25,288 | $71,667 |
| 2018 | $995 | $95,055 | $24,793 | $70,262 |
| 2017 | $986 | $93,192 | $24,307 | $68,885 |
| 2016 | $964 | $91,366 | $23,831 | $67,535 |
| 2015 | $949 | $89,995 | $23,474 | $66,521 |
| 2014 | $929 | $88,233 | $23,015 | $65,218 |
Source: Public Records
Map
Nearby Homes
- 1713 Pikake Ct
- 1833 Richard Way
- 0 5th St
- 1740 Darby Ln
- 1734 Norwood Heights Ln
- 2409 Lavon Ln
- 1655 Moffett Rd
- 2921 5th St
- 1647 Moffett Rd
- 1645 Moffett Rd
- 2590 Magnolia St
- 2644 Parkway
- 1415 Villa Way
- 1409 Villa Way
- 2605 Glasgow Dr
- 2509 E Hatch Rd
- 2511 E Hatch Rd
- 2741 Rosewood Ave
- 2841 Fowler Rd Unit 33
- 1954 Robin Dr
- 2032 Sequoia St
- 2040 Sequoia St
- 2028 Sequoia St
- 2005 Central Ave
- 2037 Hollister St
- 2024 Sequoia St
- 2033 Hollister St
- 2041 Hollister St
- 2029 Hollister St
- 2037 Sequoia St
- 2041 Sequoia St
- 2033 Sequoia St
- 2020 Sequoia St
- 2025 Hollister St
- 2029 Sequoia St
- 1957 Central Ave
- 2025 Sequoia St
- 2021 Hollister St
- 2016 Sequoia St
- 2021 Sequoia St
Your Personal Tour Guide
Ask me questions while you tour the home.