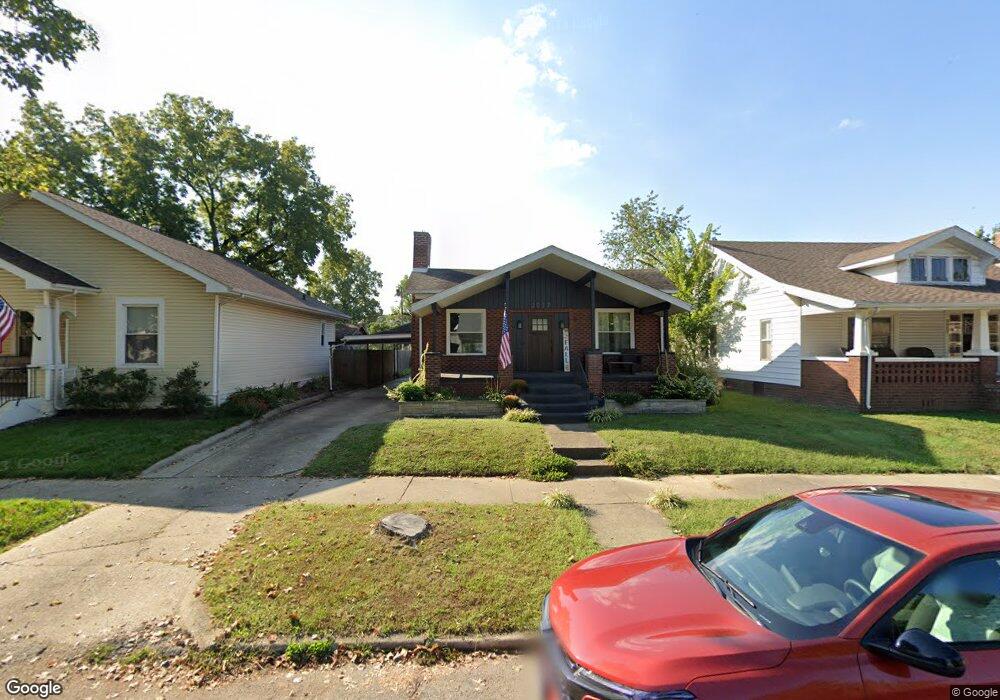
2037 Elm St Murphysboro, IL 62966
Estimated Value: $93,000 - $123,019
3
Beds
2
Baths
1,890
Sq Ft
$57/Sq Ft
Est. Value
About This Home
This home is located at 2037 Elm St, Murphysboro, IL 62966 and is currently estimated at $108,005, approximately $57 per square foot. 2037 Elm St is a home located in Jackson County with nearby schools including Murphysboro High School and Immanuel Lutheran School.
Ownership History
Date
Name
Owned For
Owner Type
Purchase Details
Closed on
May 9, 2024
Sold by
Anderson Jennifer L
Bought by
Anderson Jennifer L and Anderson Derek T
Current Estimated Value
Purchase Details
Closed on
Sep 10, 2009
Sold by
Neumann Carleen N
Bought by
Followell Jennifer L
Home Financials for this Owner
Home Financials are based on the most recent Mortgage that was taken out on this home.
Original Mortgage
$81,122
Interest Rate
5.27%
Mortgage Type
New Conventional
Create a Home Valuation Report for This Property
The Home Valuation Report is an in-depth analysis detailing your home's value as well as a comparison with similar homes in the area
Home Values in the Area
Average Home Value in this Area
Purchase History
| Date | Buyer | Sale Price | Title Company |
|---|---|---|---|
| Anderson Jennifer L | -- | None Listed On Document | |
| Followell Jennifer L | -- | None Available |
Source: Public Records
Mortgage History
| Date | Status | Borrower | Loan Amount |
|---|---|---|---|
| Previous Owner | Followell Jennifer L | $81,122 |
Source: Public Records
Tax History Compared to Growth
Tax History
| Year | Tax Paid | Tax Assessment Tax Assessment Total Assessment is a certain percentage of the fair market value that is determined by local assessors to be the total taxable value of land and additions on the property. | Land | Improvement |
|---|---|---|---|---|
| 2024 | $1,795 | $23,499 | $1,533 | $21,966 |
| 2023 | $1,618 | $20,849 | $1,360 | $19,489 |
| 2022 | $1,496 | $19,110 | $1,247 | $17,863 |
| 2021 | $1,405 | $17,929 | $1,170 | $16,759 |
| 2020 | $1,394 | $17,715 | $1,156 | $16,559 |
| 2019 | $1,279 | $17,407 | $1,136 | $16,271 |
| 2018 | $1,750 | $22,739 | $1,136 | $21,603 |
| 2017 | $1,755 | $22,739 | $1,136 | $21,603 |
| 2016 | $1,712 | $22,739 | $1,136 | $21,603 |
| 2015 | -- | $22,739 | $1,136 | $21,603 |
| 2014 | -- | $22,355 | $1,136 | $21,219 |
| 2012 | -- | $22,355 | $1,136 | $21,219 |
Source: Public Records
Map
Nearby Homes