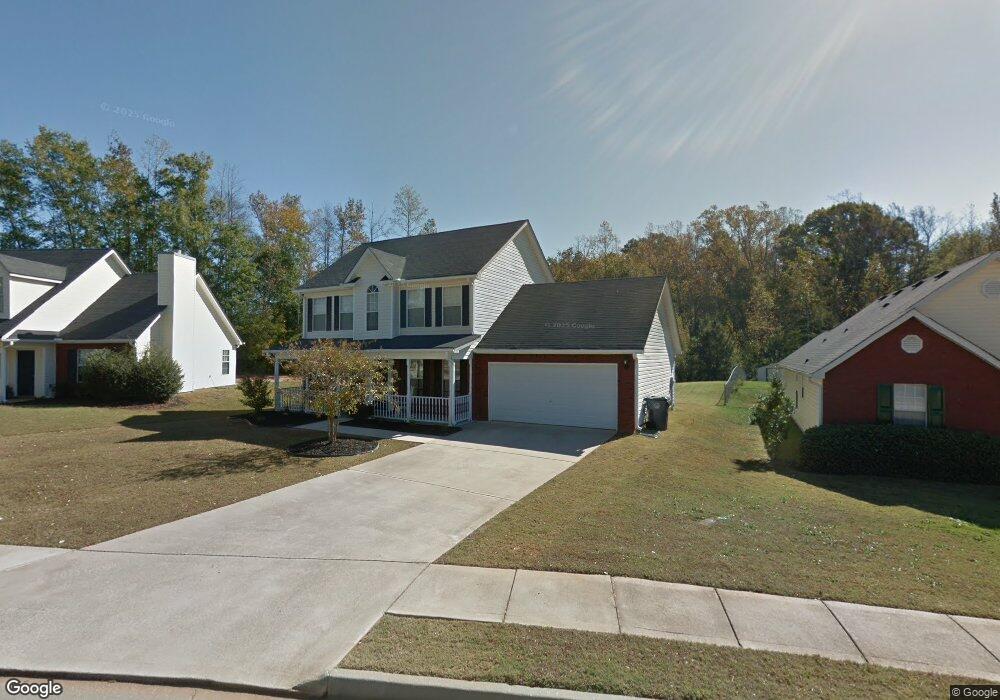
2038 Elm Grove Ln Hampton, GA 30228
Estimated Value: $274,756 - $277,000
3
Beds
3
Baths
1,942
Sq Ft
$142/Sq Ft
Est. Value
About This Home
This home is located at 2038 Elm Grove Ln, Hampton, GA 30228 and is currently estimated at $275,439, approximately $141 per square foot. 2038 Elm Grove Ln is a home located in Henry County with nearby schools including Rocky Creek Elementary School, Hampton Middle School, and Hampton High School.
Ownership History
Date
Name
Owned For
Owner Type
Purchase Details
Closed on
Oct 20, 2017
Sold by
Bawol Peter E
Bought by
Amaya-Gomez Angel
Current Estimated Value
Home Financials for this Owner
Home Financials are based on the most recent Mortgage that was taken out on this home.
Original Mortgage
$133,663
Outstanding Balance
$112,909
Interest Rate
4.25%
Mortgage Type
FHA
Estimated Equity
$162,530
Purchase Details
Closed on
Aug 17, 2005
Sold by
Bawol Peter E and Bawol Sherry
Bought by
Bawol Peter E and Bawol Jason
Purchase Details
Closed on
Jun 6, 2003
Sold by
Bawol Peter E
Bought by
Bawol Peter E and Bawol Sherry
Home Financials for this Owner
Home Financials are based on the most recent Mortgage that was taken out on this home.
Original Mortgage
$116,900
Interest Rate
5.3%
Mortgage Type
New Conventional
Create a Home Valuation Report for This Property
The Home Valuation Report is an in-depth analysis detailing your home's value as well as a comparison with similar homes in the area
Home Values in the Area
Average Home Value in this Area
Purchase History
| Date | Buyer | Sale Price | Title Company |
|---|---|---|---|
| Amaya-Gomez Angel | $144,900 | -- | |
| Bawol Peter E | -- | -- | |
| Bawol Peter E | -- | -- | |
| Bawol Peter E | $129,900 | -- |
Source: Public Records
Mortgage History
| Date | Status | Borrower | Loan Amount |
|---|---|---|---|
| Open | Amaya-Gomez Angel | $133,663 | |
| Previous Owner | Bawol Peter E | $116,900 |
Source: Public Records
Tax History Compared to Growth
Tax History
| Year | Tax Paid | Tax Assessment Tax Assessment Total Assessment is a certain percentage of the fair market value that is determined by local assessors to be the total taxable value of land and additions on the property. | Land | Improvement |
|---|---|---|---|---|
| 2025 | $3,532 | $120,600 | $12,000 | $108,600 |
| 2024 | $3,532 | $109,200 | $12,000 | $97,200 |
| 2023 | $2,560 | $101,160 | $10,000 | $91,160 |
| 2022 | $2,699 | $83,520 | $10,000 | $73,520 |
| 2021 | $1,962 | $68,120 | $10,000 | $58,120 |
| 2020 | $1,838 | $62,880 | $10,000 | $52,880 |
| 2019 | $1,705 | $56,440 | $8,000 | $48,440 |
| 2018 | $1,633 | $53,760 | $8,000 | $45,760 |
| 2016 | $1,562 | $49,480 | $4,800 | $44,680 |
| 2015 | $1,769 | $53,760 | $4,800 | $48,960 |
| 2014 | $1,056 | $34,720 | $4,800 | $29,920 |
Source: Public Records
Map
Nearby Homes
- 2040 Elm Grove Ln
- 248 Fern Ct
- 2012 Elm Grove Ln
- 1904 Elm Park Dr
- 21 Elm St
- 31 Elm St
- 53 Elm St
- 325 Peachtree Cir
- 19 Mcdonough St
- 220 Windpher Ridge
- 32 Mcdonough St
- 120 Bridgemill Dr
- 252 Sandstone Dr
- 260 Sandstone Dr
- Ashley 24 Plan at Glenmaye
- Dennis Plan at Glenmaye
- Ashley Plan at Glenmaye
- Hayden Plan at Glenmaye
- Somerset Plan at Glenmaye
- Ashley 22 Plan at Glenmaye
- 2036 Elm Grove Ln
- 2034 Elm Grove Ln
- 60 Greenville Ct
- 2042 Elm Grove Ln
- 2032 Elm Grove Ln
- 2035 Elm Grove Ln
- 70 Greenville Ct
- 50 Greenville Ct
- 2041 Elm Grove Ln
- 2041 Elm Grove Ln Unit 38
- 2044 Elm Grove Ln
- 2044 Elm Grove Ln Unit N/
- 2044 Elm Grove Ln Unit 42
- 2030 Elm Grove Ln
- 2047 Elm Grove Ln
- 0 Elm Grove Ln Unit 7004236
- 0 Elm Grove Ln Unit 3167516
- 0 Elm Grove Ln Unit 3240344
- 0 Elm Grove Ln Unit 7134122
- 0 Elm Grove Ln Unit 8403766