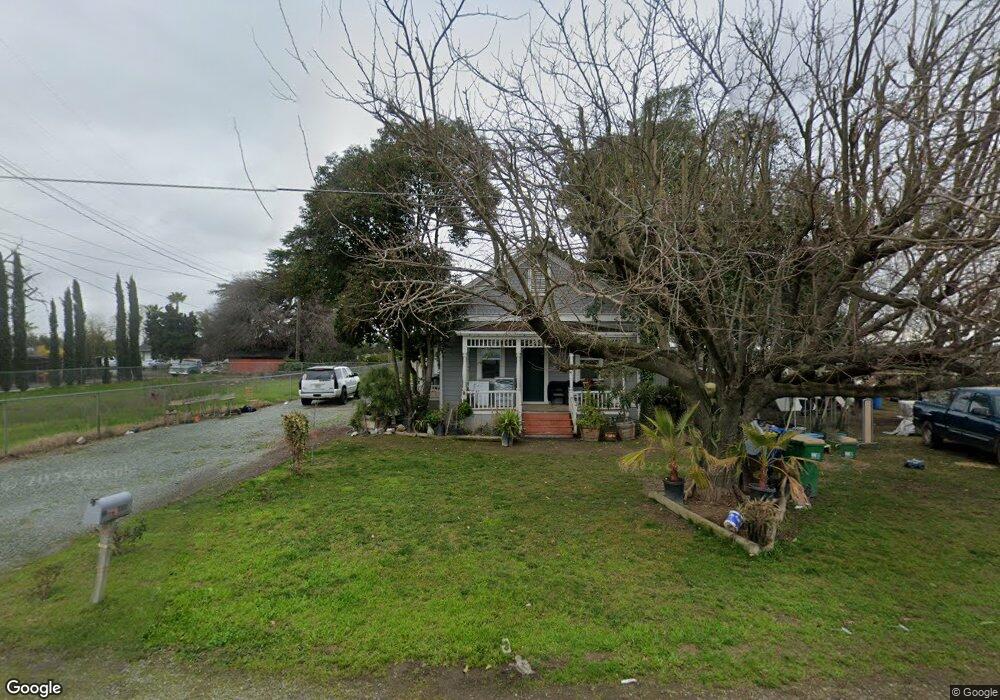
20388 N Highway 99 Acampo, CA 95220
Estimated Value: $769,000 - $949,682
3
Beds
1
Bath
1,130
Sq Ft
$758/Sq Ft
Est. Value
About This Home
This home is located at 20388 N Highway 99, Acampo, CA 95220 and is currently estimated at $856,921, approximately $758 per square foot. 20388 N Highway 99 is a home located in San Joaquin County with nearby schools including Houston School, Lodi High School, and St. Anne Elementary School.
Ownership History
Date
Name
Owned For
Owner Type
Purchase Details
Closed on
Feb 11, 2022
Sold by
Purewal Ajmer Kaur
Bought by
Singh Balwinder
Current Estimated Value
Home Financials for this Owner
Home Financials are based on the most recent Mortgage that was taken out on this home.
Original Mortgage
$559,500
Outstanding Balance
$519,601
Interest Rate
3.56%
Mortgage Type
New Conventional
Estimated Equity
$337,320
Purchase Details
Closed on
Jun 15, 2017
Sold by
Mayer Mark
Bought by
Mayer Mark S and Mayer Michelle V
Purchase Details
Closed on
Jun 29, 2006
Sold by
Meier Diane
Bought by
Mayer Mark
Create a Home Valuation Report for This Property
The Home Valuation Report is an in-depth analysis detailing your home's value as well as a comparison with similar homes in the area
Home Values in the Area
Average Home Value in this Area
Purchase History
| Date | Buyer | Sale Price | Title Company |
|---|---|---|---|
| Singh Balwinder | -- | Chicago Title | |
| Singh Baiwinder | $746,000 | Chicago Title | |
| Mayer Mark S | -- | None Available | |
| Mayer Mark | -- | None Available | |
| Mayer Mark | -- | None Available |
Source: Public Records
Mortgage History
| Date | Status | Borrower | Loan Amount |
|---|---|---|---|
| Open | Singh Baiwinder | $559,500 | |
| Closed | Singh Balwinder | $559,500 |
Source: Public Records
Tax History Compared to Growth
Tax History
| Year | Tax Paid | Tax Assessment Tax Assessment Total Assessment is a certain percentage of the fair market value that is determined by local assessors to be the total taxable value of land and additions on the property. | Land | Improvement |
|---|---|---|---|---|
| 2025 | $9,249 | $791,659 | $530,604 | $261,055 |
| 2024 | $9,015 | $776,138 | $520,200 | $255,938 |
| 2023 | $8,800 | $760,920 | $510,000 | $250,920 |
| 2022 | $2,120 | $143,055 | $50,066 | $92,989 |
| 2021 | $1,791 | $140,251 | $49,085 | $91,166 |
| 2020 | $1,576 | $138,804 | $48,582 | $90,222 |
| 2019 | $1,545 | $136,084 | $47,630 | $88,454 |
| 2018 | $1,524 | $133,418 | $46,697 | $86,721 |
| 2017 | $1,490 | $130,803 | $45,782 | $85,021 |
| 2016 | $1,399 | $128,238 | $44,885 | $83,353 |
| 2014 | $1,351 | $123,839 | $43,345 | $80,494 |
Source: Public Records
Map
Nearby Homes
- 20388 N State Route 99 E Fron
- 19690 California 99 Unit 121
- 19690 California 99 Unit 27
- 19690 N Highway 99 Unit 26
- 19690 N Highway 99 Unit 24
- 19690 N Highway 99 Unit 66
- 19690 N Highway 99 Unit 8
- 19690 N Highway 99 Unit 162
- 19450 Hidden Lakes Ln
- 21649 N Des Moines Rd
- 43 Rio Vista Dr
- 1132 Rivergate Dr Unit 13
- 0 N Sycamore Rd
- 216 San Juan Dr
- 219 San Juan Dr
- 220 Madera Dr
- 26 River Pointe Way
- 177 San Marcos Dr
- 335 Donner Dr
- 127 Camino Real Dr
- 20446 N St Rt 99 East Frontage Rd
- 20422 N Highway 99
- 20282 N Highway 99
- 20518 N Highway 99
- 20303 N Highway 99
- 20666 N Highway 99
- 20639 N Highway 99
- 20525 N St Rt 99 W Fron Rd
- 20388 N St Rt 99 E Fron Rd
- 19996 N Highway 99
- 4350 E Acampo Rd
- 20831 N St Rt 99 West Frontage Rd
- 20831 N State Route 99 West Fron Rd
- 20868 N Highway 99
- 20498 N Highway 99
- 19869 N 99 Frontage Rd
- 19810 California 99
- 19825 N State Route 99 Frontage Rd E
- 4240 E Acampo Rd
- 4000 E Acampo Rd