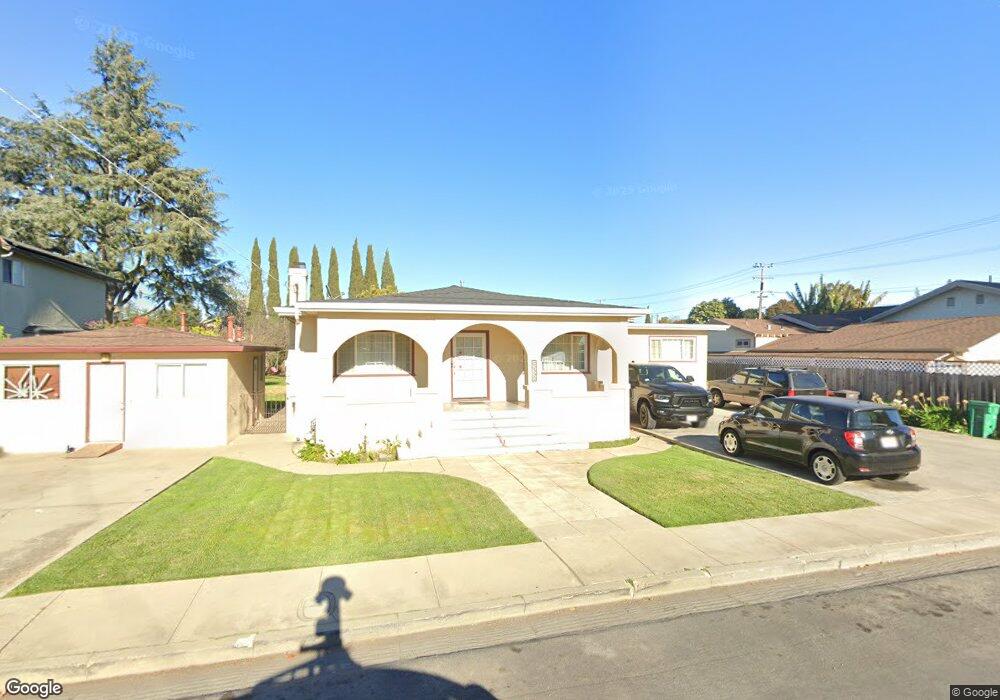
20390 Concord Ave Unit 69 Hayward, CA 94541
Estimated Value: $724,000 - $926,000
2
Beds
1
Bath
1,880
Sq Ft
$421/Sq Ft
Est. Value
About This Home
This home is located at 20390 Concord Ave Unit 69, Hayward, CA 94541 and is currently estimated at $791,217, approximately $420 per square foot. 20390 Concord Ave Unit 69 is a home located in Alameda County with nearby schools including Colonial Acres Elementary School, Edendale Middle, and San Lorenzo High School.
Ownership History
Date
Name
Owned For
Owner Type
Purchase Details
Closed on
Jun 25, 1993
Sold by
Rynberg Kenneth L and Rynberg Cheryl A
Bought by
Canha Rui and Canha Martha L
Current Estimated Value
Create a Home Valuation Report for This Property
The Home Valuation Report is an in-depth analysis detailing your home's value as well as a comparison with similar homes in the area
Home Values in the Area
Average Home Value in this Area
Purchase History
| Date | Buyer | Sale Price | Title Company |
|---|---|---|---|
| Canha Rui | -- | -- |
Source: Public Records
Tax History Compared to Growth
Tax History
| Year | Tax Paid | Tax Assessment Tax Assessment Total Assessment is a certain percentage of the fair market value that is determined by local assessors to be the total taxable value of land and additions on the property. | Land | Improvement |
|---|---|---|---|---|
| 2025 | $6,363 | $478,327 | $143,498 | $334,829 |
| 2024 | $6,363 | $468,948 | $140,684 | $328,264 |
| 2023 | $6,336 | $459,754 | $137,926 | $321,828 |
| 2022 | $6,241 | $450,740 | $135,222 | $315,518 |
| 2021 | $6,070 | $441,903 | $132,571 | $309,332 |
| 2020 | $5,938 | $437,374 | $131,212 | $306,162 |
| 2019 | $5,944 | $428,798 | $128,639 | $300,159 |
| 2018 | $5,611 | $420,393 | $126,118 | $294,275 |
| 2017 | $5,356 | $412,151 | $123,645 | $288,506 |
| 2016 | $5,111 | $404,070 | $121,221 | $282,849 |
| 2015 | $5,000 | $398,001 | $119,400 | $278,601 |
| 2014 | $4,927 | $390,207 | $117,062 | $273,145 |
Source: Public Records
Map
Nearby Homes
- 19641 Medford Cir Unit 5
- 550 Blossom Way
- 823 Blossom Way
- 20923 Haviland Ave
- 263 Medford Ave
- 641 Jordan Way
- 436 Grove Way
- 20919 Locust St Unit K
- 18905 Standish Ave
- 1470 171st Ave
- 1530 172nd Ave
- 16931 Melody Way
- 19884 Meekland Ave
- 1560 170th Ave
- 19539 Meekland Ave
- 347 Willow Ave Unit 6
- 21117 Gary Dr Unit 105
- 21117 Gary Dr Unit 217
- 21117 Gary Dr Unit 106
- 17324 Ehle St
- 20374 Concord Ave
- 710 Medford Ave
- 740 Medford Ave
- 20389 Concord Ave
- 20433 Concord Ave
- 752 Medford Ave
- 20342 Concord Ave
- 694 Medford Ave
- 756 Medford Ave
- 20326 Concord Ave
- 760 Medford Ave
- 20359 Concord Ave
- 20331 Concord Ave
- 678 Medford Ave
- 723 Medford Ave
- 727 Medford Ave
- 713 Medford Ave
- 20357 Concord Ave
- 709 Medford Ave
- 20815 Cambridge Ave