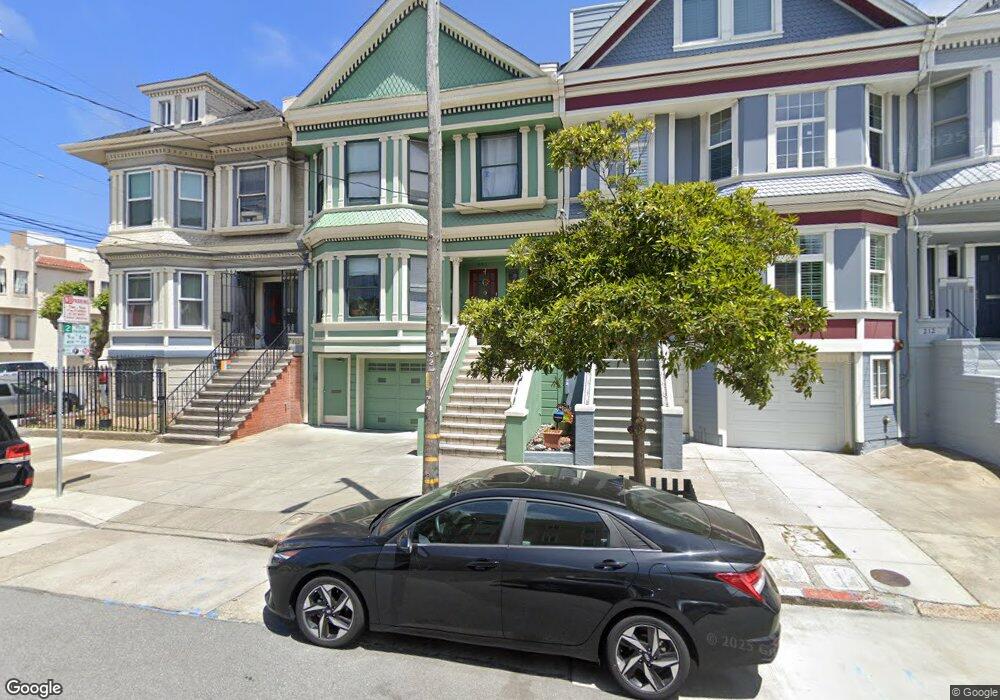
204 2nd Ave Unit 206 San Francisco, CA 94118
Inner Richmond NeighborhoodEstimated Value: $1,764,000 - $3,341,420
5
Beds
5
Baths
3,650
Sq Ft
$653/Sq Ft
Est. Value
About This Home
This home is located at 204 2nd Ave Unit 206, San Francisco, CA 94118 and is currently estimated at $2,383,355, approximately $652 per square foot. 204 2nd Ave Unit 206 is a home located in San Francisco County with nearby schools including George Peabody Elementary, Roosevelt Middle School, and Presidio Hill School.
Ownership History
Date
Name
Owned For
Owner Type
Purchase Details
Closed on
Feb 28, 2013
Sold by
Kwan Chuk W and Kwan Margreta C
Bought by
Kwan Chuk W
Current Estimated Value
Home Financials for this Owner
Home Financials are based on the most recent Mortgage that was taken out on this home.
Original Mortgage
$872,000
Interest Rate
3.34%
Mortgage Type
Commercial
Purchase Details
Closed on
Sep 20, 2005
Sold by
The Chuk W Kwan & Margreta C Kwan Family
Bought by
Kwan Chuk W and Kwan Margreta C
Home Financials for this Owner
Home Financials are based on the most recent Mortgage that was taken out on this home.
Original Mortgage
$975,000
Interest Rate
5.72%
Mortgage Type
Commercial
Purchase Details
Closed on
Feb 25, 1998
Sold by
Kwan Chuk W and Kwan Margreta
Bought by
Kwan Chuk W and Kwan Margreta C
Create a Home Valuation Report for This Property
The Home Valuation Report is an in-depth analysis detailing your home's value as well as a comparison with similar homes in the area
Home Values in the Area
Average Home Value in this Area
Purchase History
| Date | Buyer | Sale Price | Title Company |
|---|---|---|---|
| Kwan Chuk W | -- | Old Republic Title Company | |
| Kwan Chuk W | -- | -- | |
| Kwan Chuk W | -- | -- |
Source: Public Records
Mortgage History
| Date | Status | Borrower | Loan Amount |
|---|---|---|---|
| Closed | Kwan Chuk W | $872,000 | |
| Closed | Kwan Chuk W | $975,000 |
Source: Public Records
Tax History Compared to Growth
Tax History
| Year | Tax Paid | Tax Assessment Tax Assessment Total Assessment is a certain percentage of the fair market value that is determined by local assessors to be the total taxable value of land and additions on the property. | Land | Improvement |
|---|---|---|---|---|
| 2025 | $8,455 | $648,804 | $104,165 | $544,639 |
| 2024 | $8,455 | $636,083 | $102,123 | $533,960 |
| 2023 | $8,230 | $623,612 | $100,121 | $523,491 |
| 2022 | $8,049 | $611,385 | $98,158 | $513,227 |
| 2021 | $7,906 | $599,398 | $96,234 | $503,164 |
| 2020 | $8,054 | $593,254 | $95,248 | $498,006 |
| 2019 | $7,788 | $581,623 | $93,381 | $488,242 |
| 2018 | $7,524 | $570,219 | $91,550 | $478,669 |
| 2017 | $7,140 | $559,039 | $89,755 | $469,284 |
| 2016 | $6,999 | $548,079 | $87,996 | $460,083 |
| 2015 | $6,908 | $539,848 | $86,675 | $453,173 |
| 2014 | $6,730 | $529,275 | $84,978 | $444,297 |
Source: Public Records
Map
Nearby Homes
- 130 2nd Ave
- 3234 Clement St
- 3975 Clay St
- 38 Presidio Terrace
- 3 Presidio Terrace
- 334-336 4th Ave
- 236 6th Ave Unit 238
- 56-58 Parker Ave
- 3657 California St
- 116 Cherry St
- 120 7th Ave
- 185 7th Ave
- 432 4th Ave
- 622 Spruce St
- 371 6th Ave
- 474 2nd Ave
- 373 6th Ave
- 374 376 Funston Ave
- 4328 Geary Blvd
- 3515 Sacramento St
- 210 2nd Ave
- 212 2nd Ave
- 218 2nd Ave
- 216 2nd Ave
- 222 2nd Ave
- 33 Cornwall St
- 208 2nd Ave Unit 210
- 226 2nd Ave Unit 4
- 226 2nd Ave Unit 3
- 226 2nd Ave Unit 2
- 226 2nd Ave Unit 1
- 226 2nd Ave
- 5 Cornwall St Unit 201
- 5 Cornwall St Unit 401
- 5 Cornwall St Unit 301
- 115 Cornwall St
- 230 2nd Ave Unit 3
- 230 2nd Ave Unit 1
- 230 2nd Ave
- 211 2nd Ave