Estimated Value: $197,000 - $261,000
3
Beds
2
Baths
1,176
Sq Ft
$191/Sq Ft
Est. Value
About This Home
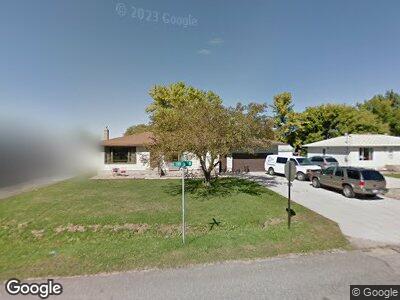
This home is located at 204 3rd St N, Sabin, MN 56580 and is currently estimated at $225,004, approximately $191 per square foot. 204 3rd St N is a home located in Clay County with nearby schools including Dorothy Dodds Elementary School, Horizon Middle School, and Moorhead High School.
Ownership History
Date
Name
Owned For
Owner Type
Purchase Details
Closed on
Mar 1, 2019
Sold by
Church James Thomas
Bought by
Church Carey Nickole
Current Estimated Value
Purchase Details
Closed on
Aug 21, 2007
Sold by
Crabtree Ronald R and Crabtree Bonnie L
Bought by
Church James T and Church Carey N
Home Financials for this Owner
Home Financials are based on the most recent Mortgage that was taken out on this home.
Original Mortgage
$1,000
Interest Rate
6.77%
Mortgage Type
New Conventional
Create a Home Valuation Report for This Property
The Home Valuation Report is an in-depth analysis detailing your home's value as well as a comparison with similar homes in the area
Home Values in the Area
Average Home Value in this Area
Purchase History
| Date | Buyer | Sale Price | Title Company |
|---|---|---|---|
| Church Carey Nickole | -- | None Available | |
| Church James T | $1,430,001 | None Available |
Source: Public Records
Mortgage History
| Date | Status | Borrower | Loan Amount |
|---|---|---|---|
| Open | Church Carey N | $134,000 | |
| Previous Owner | Church James T | $1,000 | |
| Previous Owner | Crabtree Ronald R | $102,750 |
Source: Public Records
Tax History Compared to Growth
Tax History
| Year | Tax Paid | Tax Assessment Tax Assessment Total Assessment is a certain percentage of the fair market value that is determined by local assessors to be the total taxable value of land and additions on the property. | Land | Improvement |
|---|---|---|---|---|
| 2024 | $2,462 | $210,100 | $25,200 | $184,900 |
| 2023 | $2,578 | $208,700 | $25,200 | $183,500 |
| 2022 | $2,300 | $189,800 | $25,200 | $164,600 |
| 2021 | $2,396 | $170,000 | $25,200 | $144,800 |
| 2020 | $2,324 | $171,800 | $25,200 | $146,600 |
| 2019 | $2,100 | $171,800 | $25,200 | $146,600 |
| 2018 | $2,092 | $164,100 | $25,200 | $138,900 |
| 2017 | $1,966 | $156,200 | $23,000 | $133,200 |
| 2016 | $1,792 | $147,400 | $20,300 | $127,100 |
| 2015 | $1,612 | $123,800 | $10,900 | $112,900 |
| 2014 | $1,634 | $123,800 | $10,900 | $112,900 |
Source: Public Records
Map
Nearby Homes