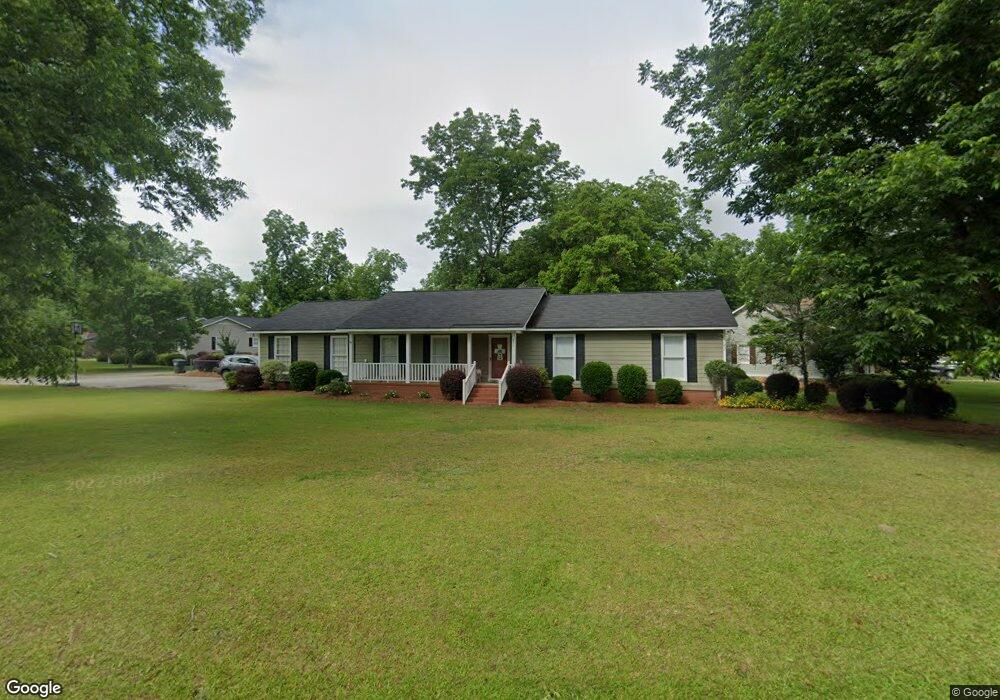
204 Cedar Lake Cir Cordele, GA 31015
Estimated Value: $188,943 - $286,000
3
Beds
2
Baths
1,766
Sq Ft
$142/Sq Ft
Est. Value
About This Home
This home is located at 204 Cedar Lake Cir, Cordele, GA 31015 and is currently estimated at $249,986, approximately $141 per square foot. 204 Cedar Lake Cir is a home located in Crisp County with nearby schools including Crisp County Elementary School, Crisp County Primary School, and Crisp County Middle School.
Ownership History
Date
Name
Owned For
Owner Type
Purchase Details
Closed on
Apr 9, 2015
Sold by
Black Tracy
Bought by
Black Tracy and Stewart Marcus E
Current Estimated Value
Home Financials for this Owner
Home Financials are based on the most recent Mortgage that was taken out on this home.
Original Mortgage
$118,400
Outstanding Balance
$91,837
Interest Rate
3.95%
Mortgage Type
New Conventional
Estimated Equity
$158,149
Purchase Details
Closed on
Apr 10, 2001
Sold by
Sangster Robert M and Sangster Connie
Bought by
Sangster Connie P
Purchase Details
Closed on
Sep 4, 1996
Sold by
Fallaw Laura Lisa
Bought by
Sangster Robert M and Sangster Connie P
Purchase Details
Closed on
Aug 30, 1991
Sold by
Akin John Shannon
Bought by
Akin Laura Lisa
Purchase Details
Closed on
Jul 2, 1991
Sold by
Hill John Clay Etal
Bought by
Akin John Shannon
Purchase Details
Closed on
Jun 30, 1986
Bought by
Hill John Clay Etal
Create a Home Valuation Report for This Property
The Home Valuation Report is an in-depth analysis detailing your home's value as well as a comparison with similar homes in the area
Home Values in the Area
Average Home Value in this Area
Purchase History
| Date | Buyer | Sale Price | Title Company |
|---|---|---|---|
| Black Tracy | -- | -- | |
| Black Tracy | $150,500 | -- | |
| Sangster Connie P | -- | -- | |
| Sangster Robert M | $88,000 | -- | |
| Akin Laura Lisa | $68,000 | -- | |
| Akin John Shannon | $68,000 | -- | |
| Hill John Clay Etal | $61,800 | -- |
Source: Public Records
Mortgage History
| Date | Status | Borrower | Loan Amount |
|---|---|---|---|
| Open | Black Tracy | $118,400 | |
| Closed | Black Tracy | $118,400 |
Source: Public Records
Tax History Compared to Growth
Tax History
| Year | Tax Paid | Tax Assessment Tax Assessment Total Assessment is a certain percentage of the fair market value that is determined by local assessors to be the total taxable value of land and additions on the property. | Land | Improvement |
|---|---|---|---|---|
| 2024 | $1,749 | $64,594 | $1,800 | $62,794 |
| 2023 | $1,724 | $61,390 | $1,800 | $59,590 |
| 2022 | $1,634 | $58,187 | $1,800 | $56,387 |
| 2021 | $1,630 | $54,984 | $1,800 | $53,184 |
| 2020 | $1,633 | $54,984 | $1,800 | $53,184 |
| 2019 | $1,623 | $54,984 | $1,800 | $53,184 |
| 2018 | $1,432 | $46,749 | $3,240 | $43,509 |
| 2017 | $1,438 | $46,749 | $3,240 | $43,509 |
| 2016 | $1,436 | $46,749 | $3,240 | $43,509 |
| 2015 | -- | $46,749 | $3,240 | $43,509 |
| 2014 | -- | $46,749 | $3,240 | $43,509 |
| 2013 | -- | $45,227 | $3,240 | $41,987 |
Source: Public Records
Map
Nearby Homes
- 2115 Royal Rd
- 157 Bobwhite Dr
- 304 Timberland Dr
- 2298 U S 41
- 1022 E 29th Ave
- 112 Judy Ave
- 615 E 28th Ave
- 141 Ruby St
- 618 E 27th Ave
- 724 E 26th Ave
- TBD Aberdeen Circle Lt# 28
- 607 E 27th Ave
- 619 E 26th Ave
- 118 Joe Wright Drive New Harvest Rd
- 118 Joe Wright Dr
- 510 E 25th Ave
- 1606 S 5th St
- 723 E 24th Ave
- 616 E 23rd Ave
- 912 Rose Ln
- 206 Cedar Lake Cir
- 206 Cedar Lake Cir
- 206 Cedar Lake Cir
- 203 Cedar Lake Cir
- 106 Cedar Lake Cir
- 201 Cedar Lake Cir
- 207 Cedar Lake Cir
- 107 Cedar Lake Cir
- 107 Cedar Lake Cir
- 209 Cedar Lake Cir
- 0 Lot 10 Landing Sub
- 0 Swann Home E
- 0 L12 Saddle Creek Dr
- 0 Lt7 Saddle Creek Dr
- 0 550acres McKinney Rd
- XX Ga Hwy 300
- 0 E 13th Ave Tract #2
- 210 Cedar Lake Cir
- 104 Cedar Lake Cir
- 113 Cedar Lake Dr