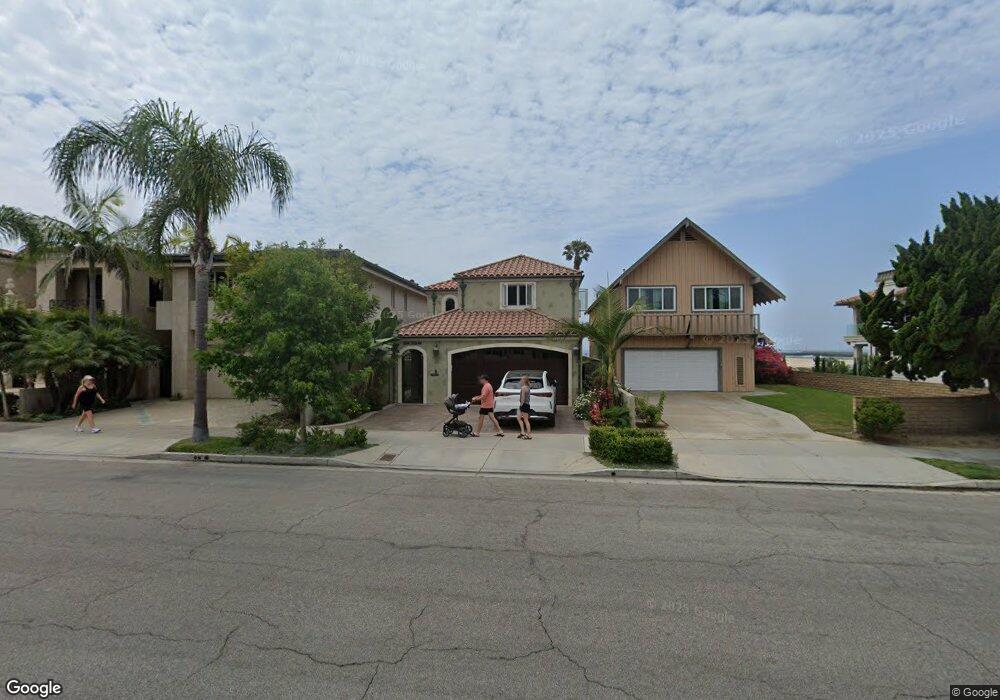
204 Ocean Ave Seal Beach, CA 90740
Estimated Value: $3,051,000 - $4,293,000
4
Beds
4
Baths
3,302
Sq Ft
$1,074/Sq Ft
Est. Value
About This Home
This home is located at 204 Ocean Ave, Seal Beach, CA 90740 and is currently estimated at $3,546,301, approximately $1,073 per square foot. 204 Ocean Ave is a home located in Orange County with nearby schools including J. H. Mcgaugh Elementary School, Jack L. Weaver Elementary School, and Sharon Christa Mcauliffe Middle School.
Ownership History
Date
Name
Owned For
Owner Type
Purchase Details
Closed on
Jul 26, 2013
Sold by
Brendel Michelle Anderson
Bought by
Brendel Michelle Anderson and Bruce Moe Stark & Michelle Anderson Bren
Current Estimated Value
Home Financials for this Owner
Home Financials are based on the most recent Mortgage that was taken out on this home.
Original Mortgage
$1,832,175
Interest Rate
3.92%
Mortgage Type
Seller Take Back
Purchase Details
Closed on
Jun 12, 2007
Sold by
Stark Bruce Moe and Brendel Michelle Anderson
Bought by
Stark Bruce Moe and Brendel Michelle Anderson
Create a Home Valuation Report for This Property
The Home Valuation Report is an in-depth analysis detailing your home's value as well as a comparison with similar homes in the area
Home Values in the Area
Average Home Value in this Area
Purchase History
| Date | Buyer | Sale Price | Title Company |
|---|---|---|---|
| Brendel Michelle Anderson | -- | None Available | |
| Stark Bruce Moe | -- | None Available | |
| Stark Bruce Moe | -- | None Available |
Source: Public Records
Mortgage History
| Date | Status | Borrower | Loan Amount |
|---|---|---|---|
| Closed | Brendel Michelle Anderson | $1,832,175 |
Source: Public Records
Tax History Compared to Growth
Tax History
| Year | Tax Paid | Tax Assessment Tax Assessment Total Assessment is a certain percentage of the fair market value that is determined by local assessors to be the total taxable value of land and additions on the property. | Land | Improvement |
|---|---|---|---|---|
| 2025 | $13,997 | $1,229,858 | $718,480 | $511,378 |
| 2024 | $13,997 | $1,205,744 | $704,393 | $501,351 |
| 2023 | $13,688 | $1,182,102 | $690,581 | $491,521 |
| 2022 | $13,551 | $1,158,924 | $677,040 | $481,884 |
| 2021 | $12,718 | $1,088,400 | $663,764 | $424,636 |
| 2020 | $12,740 | $1,077,240 | $656,958 | $420,282 |
| 2019 | $12,061 | $1,056,118 | $644,076 | $412,042 |
| 2018 | $11,506 | $1,035,410 | $631,447 | $403,963 |
| 2017 | $11,268 | $1,015,108 | $619,065 | $396,043 |
| 2016 | $11,058 | $995,204 | $606,926 | $388,278 |
| 2015 | $10,927 | $980,256 | $597,810 | $382,446 |
| 2014 | $10,666 | $961,055 | $586,100 | $374,955 |
Source: Public Records
Map
Nearby Homes