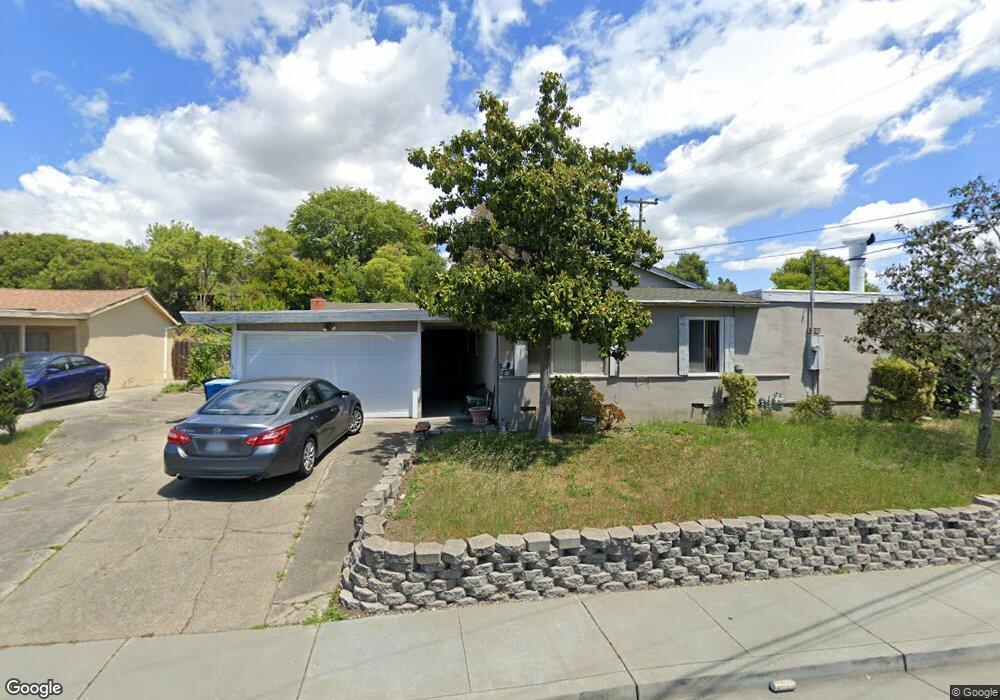
204 Sage St Vallejo, CA 94589
North Vallejo NeighborhoodEstimated Value: $460,000 - $559,000
5
Beds
2
Baths
1,831
Sq Ft
$271/Sq Ft
Est. Value
About This Home
This home is located at 204 Sage St, Vallejo, CA 94589 and is currently estimated at $496,461, approximately $271 per square foot. 204 Sage St is a home located in Solano County with nearby schools including Elsa Widenmann Elementary, Solano Middle School, and Vallejo High School.
Ownership History
Date
Name
Owned For
Owner Type
Purchase Details
Closed on
Sep 29, 2010
Sold by
Bowie Nelson Margie B
Bought by
Bowie Nelson Margie B and Bowie Nelson Revocable Living
Current Estimated Value
Purchase Details
Closed on
Aug 3, 2004
Sold by
Bowie Nelson Margie B
Bought by
Bowie Nelson Margie B and Bowie Nelson Family Trust
Home Financials for this Owner
Home Financials are based on the most recent Mortgage that was taken out on this home.
Original Mortgage
$258,058
Interest Rate
6.29%
Mortgage Type
New Conventional
Purchase Details
Closed on
Jul 20, 2004
Sold by
Bowie Nelson Margie B and Bowie Nelson Family Trust
Bought by
Bowie Nelson Margie B
Home Financials for this Owner
Home Financials are based on the most recent Mortgage that was taken out on this home.
Original Mortgage
$258,058
Interest Rate
6.29%
Mortgage Type
New Conventional
Create a Home Valuation Report for This Property
The Home Valuation Report is an in-depth analysis detailing your home's value as well as a comparison with similar homes in the area
Home Values in the Area
Average Home Value in this Area
Purchase History
| Date | Buyer | Sale Price | Title Company |
|---|---|---|---|
| Bowie Nelson Margie B | -- | None Available | |
| Bowie Nelson Margie B | -- | None Available | |
| Bowie Nelson Margie B | -- | -- | |
| Bowie Nelson Margie B | -- | Fidelity Title Co |
Source: Public Records
Mortgage History
| Date | Status | Borrower | Loan Amount |
|---|---|---|---|
| Previous Owner | Bowie Nelson Margie B | $258,058 |
Source: Public Records
Tax History
| Year | Tax Paid | Tax Assessment Tax Assessment Total Assessment is a certain percentage of the fair market value that is determined by local assessors to be the total taxable value of land and additions on the property. | Land | Improvement |
|---|---|---|---|---|
| 2025 | $2,146 | $103,262 | $22,649 | $80,613 |
| 2024 | $2,146 | $101,238 | $22,205 | $79,033 |
| 2023 | $1,968 | $99,254 | $21,770 | $77,484 |
| 2022 | $1,856 | $97,309 | $21,344 | $75,965 |
| 2021 | $1,810 | $95,402 | $20,926 | $74,476 |
| 2020 | $2,065 | $94,425 | $20,712 | $73,713 |
| 2019 | $1,712 | $92,574 | $20,306 | $72,268 |
| 2018 | $1,524 | $90,759 | $19,908 | $70,851 |
| 2017 | $1,433 | $88,980 | $19,518 | $69,462 |
| 2016 | $912 | $87,236 | $19,136 | $68,100 |
| 2015 | $899 | $85,927 | $18,849 | $67,078 |
| 2014 | $885 | $84,245 | $18,480 | $65,765 |
Source: Public Records
Map
Nearby Homes
- 243 Sage St
- 157 Haviture Way
- 330 Carousel Dr
- 464 Evelyn Cir
- 0 Fairgrounds Dr Unit 325101300
- 160 Radcliffe Dr
- 475 Whitney Ave
- 355 Parkview Terrace Unit 2
- 355 Parkview Terrace Unit 1
- 355 Parkview Terrace Unit 7
- 355 Parkview Terrace Unit B9
- 355 Parkview Terrace Unit A-8
- 0 Antioch Dr
- 1457 N Camino Alto Unit 214
- 120 Persimmon Dr
- 1455 N Camino Alto Unit 138
- 150 Granite Ct
- 106 Fieldstone Way
- 1118 Waltz Ct
- 1333 N Camino Alto Unit 133
Your Personal Tour Guide
Ask me questions while you tour the home.