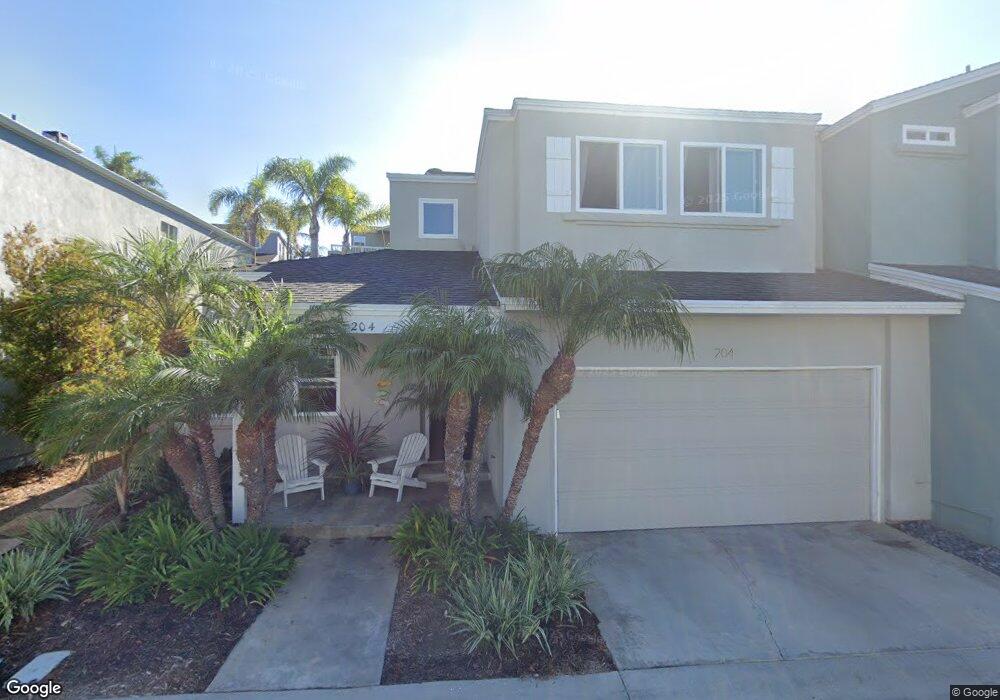
204 Triton Cir Encinitas, CA 92024
Central Encinitas NeighborhoodEstimated Value: $1,852,000 - $1,916,000
3
Beds
3
Baths
1,815
Sq Ft
$1,038/Sq Ft
Est. Value
About This Home
This home is located at 204 Triton Cir, Encinitas, CA 92024 and is currently estimated at $1,884,392, approximately $1,038 per square foot. 204 Triton Cir is a home located in San Diego County with nearby schools including Paul Ecke-Central Elementary, Oak Crest Middle School, and La Costa Canyon High School.
Ownership History
Date
Name
Owned For
Owner Type
Purchase Details
Closed on
Oct 6, 2015
Sold by
Minick Steven E
Bought by
Minick Steven E
Current Estimated Value
Home Financials for this Owner
Home Financials are based on the most recent Mortgage that was taken out on this home.
Original Mortgage
$618,750
Outstanding Balance
$486,661
Interest Rate
3.87%
Mortgage Type
New Conventional
Estimated Equity
$1,397,731
Purchase Details
Closed on
Feb 8, 2012
Sold by
Minick Steven E and Broderick Paula Andrea
Bought by
Minick Steven E
Home Financials for this Owner
Home Financials are based on the most recent Mortgage that was taken out on this home.
Original Mortgage
$269,000
Interest Rate
3.84%
Mortgage Type
New Conventional
Purchase Details
Closed on
May 18, 2000
Sold by
Minick Kimberley A
Bought by
Minick Steven E
Home Financials for this Owner
Home Financials are based on the most recent Mortgage that was taken out on this home.
Original Mortgage
$100,000
Interest Rate
7.84%
Mortgage Type
Stand Alone Second
Purchase Details
Closed on
Mar 24, 1998
Sold by
Ellingsen Paul N and Ellingsen Jenny R
Bought by
Minick Steven E and Minick Kimberley A
Home Financials for this Owner
Home Financials are based on the most recent Mortgage that was taken out on this home.
Original Mortgage
$227,000
Interest Rate
7%
Purchase Details
Closed on
Oct 30, 1997
Sold by
Ellingsen Paul N and Ellingsen Jenny R
Bought by
Ellingsen Paul N and Ellingsen Jenny R
Home Financials for this Owner
Home Financials are based on the most recent Mortgage that was taken out on this home.
Original Mortgage
$198,700
Interest Rate
7.44%
Purchase Details
Closed on
Oct 2, 1997
Sold by
Ellingsen Paul N and Ellingsen Jenny R
Bought by
Ellingsen Paul N and Ellingsen Jenny R
Home Financials for this Owner
Home Financials are based on the most recent Mortgage that was taken out on this home.
Original Mortgage
$198,700
Interest Rate
7.44%
Purchase Details
Closed on
May 2, 1989
Purchase Details
Closed on
Jan 15, 1988
Create a Home Valuation Report for This Property
The Home Valuation Report is an in-depth analysis detailing your home's value as well as a comparison with similar homes in the area
Home Values in the Area
Average Home Value in this Area
Purchase History
| Date | Buyer | Sale Price | Title Company |
|---|---|---|---|
| Minick Steven E | -- | Fidelity National Title | |
| Minick Steven E | -- | Chicago Title Company | |
| Minick Steven E | -- | Fidelity National Title | |
| Minick Steven E | $287,000 | -- | |
| Ellingsen Paul N | -- | -- | |
| Ellingsen Paul N | -- | Stewart Title | |
| -- | $263,000 | -- | |
| -- | $183,600 | -- |
Source: Public Records
Mortgage History
| Date | Status | Borrower | Loan Amount |
|---|---|---|---|
| Open | Minick Steven E | $618,750 | |
| Closed | Minick Steven E | $269,000 | |
| Previous Owner | Minick Steven E | $100,000 | |
| Previous Owner | Minick Steven E | $227,000 | |
| Previous Owner | Ellingsen Paul N | $198,700 |
Source: Public Records
Tax History
| Year | Tax Paid | Tax Assessment Tax Assessment Total Assessment is a certain percentage of the fair market value that is determined by local assessors to be the total taxable value of land and additions on the property. | Land | Improvement |
|---|---|---|---|---|
| 2025 | $5,105 | $458,244 | $234,710 | $223,534 |
| 2024 | $5,105 | $449,259 | $230,108 | $219,151 |
| 2023 | $4,970 | $440,451 | $225,597 | $214,854 |
| 2022 | $4,822 | $431,816 | $221,174 | $210,642 |
| 2021 | $4,798 | $423,350 | $216,838 | $206,512 |
| 2020 | $4,804 | $419,010 | $214,615 | $204,395 |
| 2019 | $4,711 | $410,795 | $210,407 | $200,388 |
| 2018 | $4,612 | $402,741 | $206,282 | $196,459 |
| 2017 | $4,544 | $394,845 | $202,238 | $192,607 |
| 2016 | $4,470 | $387,104 | $198,273 | $188,831 |
| 2015 | $4,468 | $381,290 | $195,295 | $185,995 |
| 2014 | $4,404 | $373,822 | $191,470 | $182,352 |
Source: Public Records
Map
Nearby Homes
- 554 & 556 Stratford Dr
- 103 Mangano Cir
- 687 S Coast Highway 101 Unit 237
- 837 Stratford Dr
- 920 Stratford Dr
- 239 4th St
- 401 Requeza St
- 538 4th St
- 201 4th St Unit A & B
- 147 4th St
- 231 5th St
- 215 N Vulcan Ave
- 548 Quail Pointe Ln
- 806 4th St
- 937 3rd St
- 100 5th St
- 664 Sea Ridge Ct
- 200 Neptune Ave Unit 2
- 1180 Devonshire Dr
- 0 Mays Hollow Ln
Your Personal Tour Guide
Ask me questions while you tour the home.