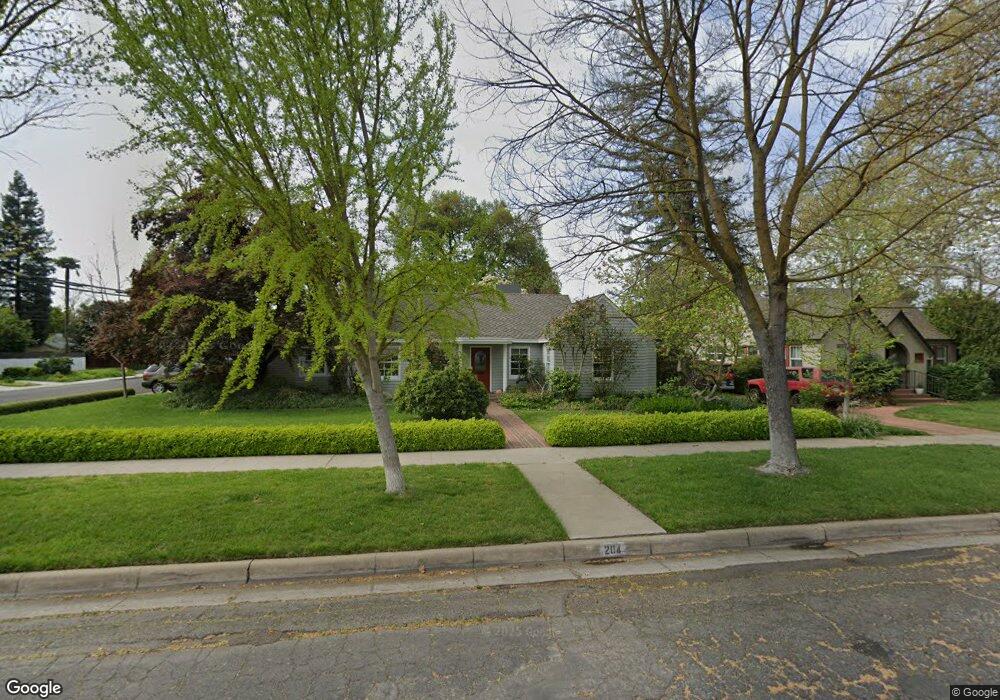
204 W 27th St Merced, CA 95340
Downtown Merced NeighborhoodEstimated Value: $283,000 - $390,000
2
Beds
2
Baths
1,602
Sq Ft
$214/Sq Ft
Est. Value
About This Home
This home is located at 204 W 27th St, Merced, CA 95340 and is currently estimated at $343,266, approximately $214 per square foot. 204 W 27th St is a home located in Merced County with nearby schools including John Muir Elementary School, Herbert Hoover Middle School, and Merced High School.
Ownership History
Date
Name
Owned For
Owner Type
Purchase Details
Closed on
Sep 22, 2005
Sold by
Aalgaard Vanda L and Packwood Vanda Lee
Bought by
Claunch Alan P and Aalgaard Vanda L
Current Estimated Value
Home Financials for this Owner
Home Financials are based on the most recent Mortgage that was taken out on this home.
Original Mortgage
$175,000
Interest Rate
5.72%
Mortgage Type
New Conventional
Create a Home Valuation Report for This Property
The Home Valuation Report is an in-depth analysis detailing your home's value as well as a comparison with similar homes in the area
Home Values in the Area
Average Home Value in this Area
Purchase History
| Date | Buyer | Sale Price | Title Company |
|---|---|---|---|
| Claunch Alan P | -- | Transcounty Title Company |
Source: Public Records
Mortgage History
| Date | Status | Borrower | Loan Amount |
|---|---|---|---|
| Closed | Claunch Alan P | $175,000 |
Source: Public Records
Tax History Compared to Growth
Tax History
| Year | Tax Paid | Tax Assessment Tax Assessment Total Assessment is a certain percentage of the fair market value that is determined by local assessors to be the total taxable value of land and additions on the property. | Land | Improvement |
|---|---|---|---|---|
| 2025 | $736 | $75,899 | $14,655 | $61,244 |
| 2024 | $736 | $74,412 | $14,368 | $60,044 |
| 2023 | $724 | $72,954 | $14,087 | $58,867 |
| 2022 | $711 | $71,524 | $13,811 | $57,713 |
| 2021 | $708 | $70,123 | $13,541 | $56,582 |
| 2020 | $711 | $69,405 | $13,403 | $56,002 |
| 2019 | $698 | $68,045 | $13,141 | $54,904 |
| 2018 | $635 | $66,712 | $12,884 | $53,828 |
| 2017 | $657 | $65,405 | $12,632 | $52,773 |
| 2016 | $645 | $64,124 | $12,385 | $51,739 |
| 2015 | $634 | $63,161 | $12,199 | $50,962 |
| 2014 | $619 | $61,925 | $11,961 | $49,964 |
Source: Public Records
Map
Nearby Homes