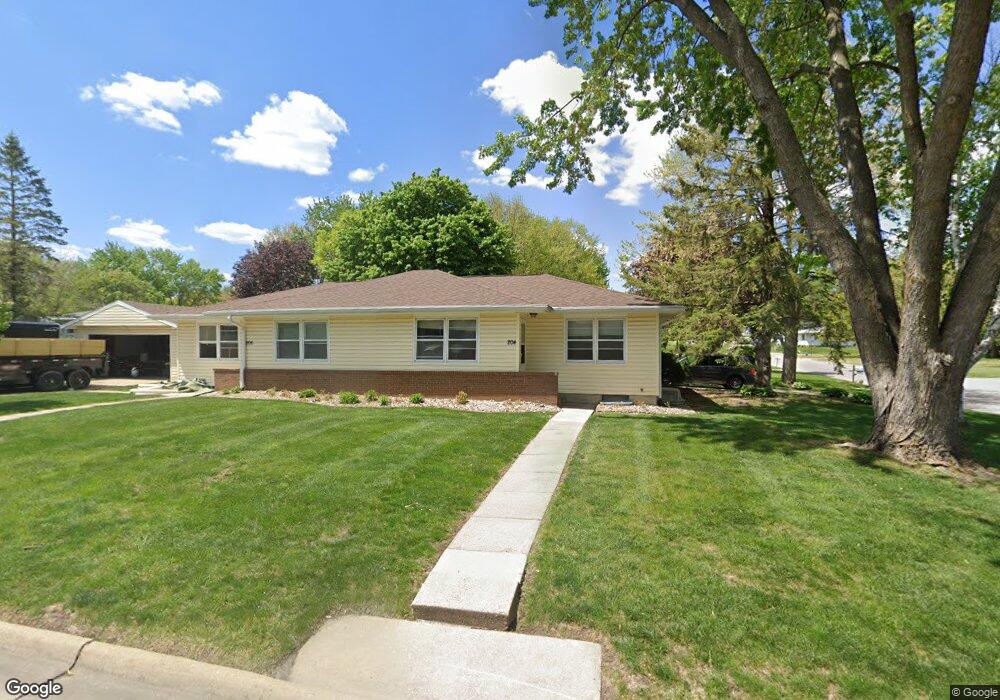
204 Westbourne Rd Unit 206 Waterloo, IA 50701
Estimated Value: $234,000 - $269,000
5
Beds
2
Baths
3,272
Sq Ft
$78/Sq Ft
Est. Value
About This Home
This home is located at 204 Westbourne Rd Unit 206, Waterloo, IA 50701 and is currently estimated at $255,027, approximately $77 per square foot. 204 Westbourne Rd Unit 206 is a home located in Black Hawk County with nearby schools including Becker Elementary School, Central Middle School, and East High School.
Ownership History
Date
Name
Owned For
Owner Type
Purchase Details
Closed on
Jun 2, 2025
Sold by
Bockes & Kunkle Holdings Llc
Bought by
3B Holdings Llc
Current Estimated Value
Purchase Details
Closed on
May 2, 2016
Sold by
Harbaugh Steven R
Bought by
Bockes & Kunkle Holdings Llc
Purchase Details
Closed on
Sep 12, 2008
Sold by
Smaldino Joseph and Smaldino Sharon
Bought by
Co Cedar Valley Property Management Ll
Home Financials for this Owner
Home Financials are based on the most recent Mortgage that was taken out on this home.
Original Mortgage
$108,000
Interest Rate
6.57%
Mortgage Type
Credit Line Revolving
Purchase Details
Closed on
Sep 11, 2008
Sold by
Smaldino Joseph and Smaldino Sharon
Bought by
Co Property Mangement Llc
Home Financials for this Owner
Home Financials are based on the most recent Mortgage that was taken out on this home.
Original Mortgage
$108,000
Interest Rate
6.57%
Mortgage Type
Credit Line Revolving
Create a Home Valuation Report for This Property
The Home Valuation Report is an in-depth analysis detailing your home's value as well as a comparison with similar homes in the area
Home Values in the Area
Average Home Value in this Area
Purchase History
| Date | Buyer | Sale Price | Title Company |
|---|---|---|---|
| 3B Holdings Llc | $266,000 | Title Services | |
| Bockes & Kunkle Holdings Llc | $177,000 | None Available | |
| Co Cedar Valley Property Management Ll | $120,000 | None Available | |
| Co Property Mangement Llc | -- | None Available |
Source: Public Records
Mortgage History
| Date | Status | Borrower | Loan Amount |
|---|---|---|---|
| Previous Owner | Co Property Mangement Llc | $108,000 |
Source: Public Records
Tax History Compared to Growth
Tax History
| Year | Tax Paid | Tax Assessment Tax Assessment Total Assessment is a certain percentage of the fair market value that is determined by local assessors to be the total taxable value of land and additions on the property. | Land | Improvement |
|---|---|---|---|---|
| 2024 | $4,096 | $188,800 | $25,560 | $163,240 |
| 2023 | $3,158 | $188,800 | $25,560 | $163,240 |
| 2022 | $3,074 | $143,760 | $25,560 | $118,200 |
| 2021 | $3,048 | $143,760 | $25,560 | $118,200 |
| 2020 | $3,000 | $134,610 | $22,150 | $112,460 |
| 2019 | $3,000 | $134,610 | $22,150 | $112,460 |
| 2018 | $2,924 | $131,170 | $22,150 | $109,020 |
| 2017 | $3,004 | $131,170 | $22,150 | $109,020 |
| 2016 | $2,966 | $130,780 | $22,150 | $108,630 |
| 2015 | $2,966 | $130,780 | $22,150 | $108,630 |
| 2014 | $3,024 | $130,780 | $22,150 | $108,630 |
Source: Public Records
Map
Nearby Homes
- 1823 Rainbow Dr
- 225 Lambeth Rd
- 131 Niagara Dr
- 2028 Tilbury Rd
- 2117 Tilbury Rd
- 2161 Rainbow Dr
- 440 S Hackett Rd
- 179 Letsch Rd
- 0 Bergen Dr
- 2622 Garden Ave
- 2602 Cedar Heights Dr
- 2727 Cedar Heights Dr
- 2005 Parrish St
- 1113 Rainbow Dr
- 2804 Neola St
- 2703 Loma St
- 3022 Neola St
- 211 Auburn St
- 437 Ardmore St
- 2522 Sunset Blvd
- 1921 Castle St
- 203 Westbourne Rd
- 1912 Castle St
- 162 Lobdell Rd
- 1927 Castle St
- 209 Westbourne Rd
- 156 Lobdell Rd
- 1924 Castle St
- 1910 Tilbury Rd
- 217 Westbourne Rd
- 1916 Tilbury Rd
- 1933 Castle St
- 150 Lobdell Rd
- 1930 Castle St
- 223 Westbourne Rd
- 1941 Castle St
- 161 Vincent Rd
- 144 Lobdell Rd
- 306 Westbourne Rd
- 163 Lobdell Rd