NOT LISTED FOR SALE

2040 N Spaulding Ave Unit 3S Chicago, IL 60647

Logan Square Neighborhood

Estimated Value: $290,000 - $382,000

2 Beds
1 Bath
1,200 Sq Ft
$271/Sq Ft Est. Value

Last Sold June 14, 2013

Last sale price $70,000 $58 Per Sq Ft

Est. 364% increase in value since last sale

Current estimated payment $2,206/month

About This Home

As of June 2013

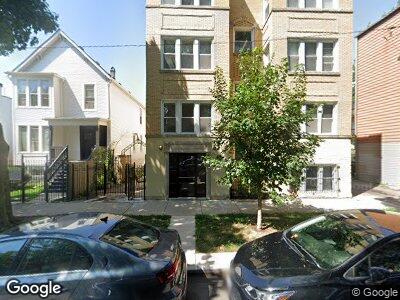
RENT THIS TOP FLOOR CONDO QUALITY TWO BEDROOM ONE BATHROOM UNIT IN LOGAN SQUARE. ONE GATED PARKING SPOT INCLUDED IN PRICE. RE-DESIGNED UNITS FEATURING NEW WALNUT STAINED HARDWOOD FLOORS THRU-OUT. DARK WOOD EURO CABINETS W/GLASS & METAL DETAIL, GRANITE COUNTERS, UNDER-MOUNTED SINKS, STAINLESS APPLIANCES. STONE MOSAIC BATH W/ MODERN VANITY. IN-UNIT W/D. available immediately

Ownership History

Date Name Owned For Owner Type

Purchase Details

Closed on
May 31, 2023
Sold by
Dvirco Llc
Bought by
Yahner Kathleen A
Current Estimated Value
$324,720

Home Financials for this Owner

Home Financials are based on the most recent Mortgage that was taken out on this home.
Original Mortgage
$216,000
Outstanding Balance
$211,887
Interest Rate
6.5%
Mortgage Type
New Conventional
Estimated Equity
$89,681

Purchase Details

Listed on
Apr 8, 2013
Closed on
Jul 9, 2013
Sold by
Givogre Mercia
Bought by
Dvirco Llc
Seller's Agent
Lonny Miller
Charles Rutenberg Realty
Buyer's Agent
Lonny Miller
Charles Rutenberg Realty
List Price
$60,000
Sold Price
$70,000
Premium/Discount to List
$10,000
16.67%

Home Financials for this Owner

Home Financials are based on the most recent Mortgage that was taken out on this home.
Avg. Annual Appreciation
13.05%

Range of Values:

Collateral Analytics

Collateral Analytics Collateral Analytics AVMs (Automated Valuation Model) employ a number of statistical approaches combined with neighborhood-specific comparable selection guarantees the most up-to-date and precise valuations.

Not Available

Collateral Analytics does not have data for the current month. Please view the chart for historical values.

ICE

ICE Mortgage Technology ICE Mortgage Technology’s AVM (Automated Valuation Model) is a state-of-the-art online residential property valuation tool that provides a quick and accurate estimate of the value of almost any home in the U.S.

Not Available

ICE Mortgage Technology does not have data for the current month. Please view the chart for historical values.

First American

First American First American Data & Analytics’ next-generation AVM combines unrivaled data assets with a blended ensemble of valuation models to produce highly accurate, reliable valuations you can trust.

Not Available

First American does not have data for the current month. Please view the chart for historical values.

Quantarium

Quantarium Quantarium’s valuation service, repeatedly proven the industry’s most accurate and comprehensive, is supercharged with a self-learning and auto-tuning AI engine that continually becomes smarter and more accurate as it processes daily inputs from the industry’s leading RE data lake.

Not Available

Quantarium does not have data for the current month. Please view the chart for historical values.

Average Value
Not Available
List Price
Sold Price
Create a Home Valuation Report for This Property
The Home Valuation Report is an in-depth analysis detailing your home's value as well as a comparison with similar homes in the area

Home Values in the Area

Source: Public Records

Average Home Value in this Area


Source: Public Records

Purchase History

Date Buyer Sale Price Title Company
Yahner Kathleen A $240,000 Chicago Title
Dvirco Llc $70,000 Fidelity National Title
Source: Public Records

Mortgage History

Date Status Borrower Loan Amount
Open Yahner Kathleen A $216,000
Previous Owner Givogre Mercia $24,490
Source: Public Records

Property History

Date Event Price Change Sq Ft Price
12/01/2020 12/01/20 Rented $1,300 0.0% --
10/26/2020 10/26/20 Price Changed $1,300 -10.3% $1 / Sq Ft
10/06/2020 10/06/20 Price Changed $1,450 -9.4% $1 / Sq Ft
08/13/2020 08/13/20 For Rent $1,600 0.0% --
12/15/2019 12/15/19 Rented $1,600 0.0% --
10/30/2019 10/30/19 For Rent $1,600 +6.7% --
06/20/2017 06/20/17 Rented $1,500 0.0% --
05/15/2017 05/15/17 For Rent $1,500 0.0% --
06/14/2013 06/14/13 Sold $70,000 +16.7% --
04/08/2013 04/08/13 Pending -- -- --
04/08/2013 04/08/13 For Sale $60,000 -- --

Tax History Compared to Growth

Source: Public Records

Tax History

Year Tax Paid Tax Assessment Tax Assessment Total Assessment is a certain percentage of the fair market value that is determined by local assessors to be the total taxable value of land and additions on the property. Land Improvement
2024 $5,779 $28,398 $1,953 $26,445
2023 $5,779 $28,001 $1,584 $26,417
2022 $5,779 $28,001 $1,584 $26,417
2021 $5,649 $27,999 $1,583 $26,416
2020 $4,801 $21,475 $765 $20,710
2019 $4,862 $24,113 $765 $23,348
2018 $4,763 $24,113 $765 $23,348
2017 $2,761 $12,825 $686 $12,139
2016 $2,569 $12,825 $686 $12,139
2015 $2,350 $12,825 $686 $12,139
2014 $1,712 $9,229 $633 $8,596
2013 $1,931 $10,615 $633 $9,982
Source: Public Records

Agents Affiliated with this Home

  • Section Image
  • Section Image
  • Section Image
See All Agents

Map