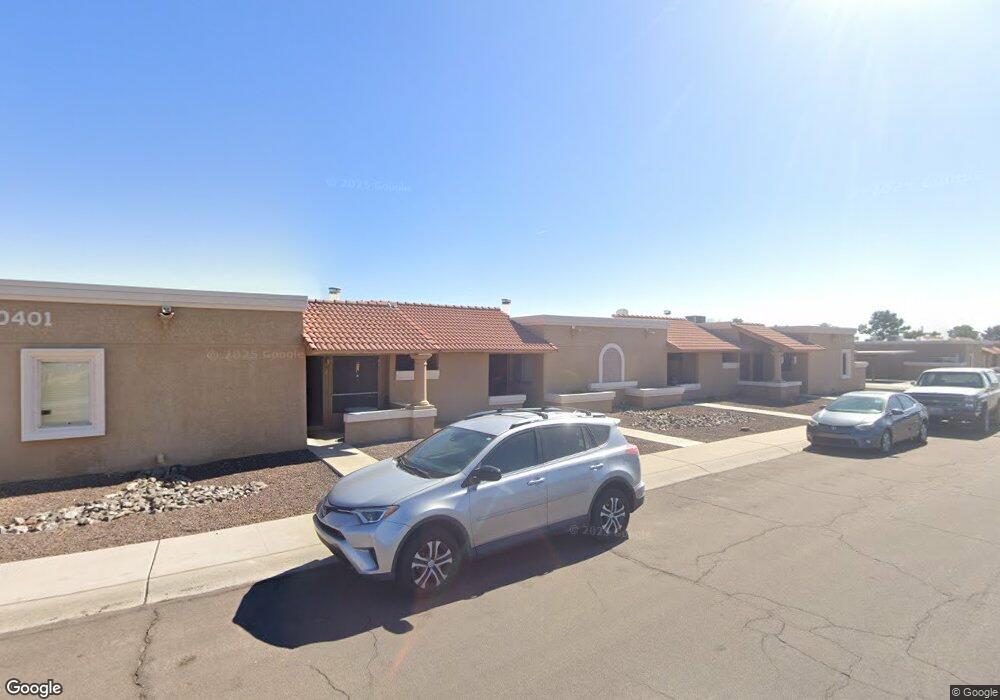
20401 N 3rd Dr Unit 1 Phoenix, AZ 85027
North Deer Valley NeighborhoodEstimated Value: $252,000 - $266,000
2
Beds
2
Baths
994
Sq Ft
$259/Sq Ft
Est. Value
About This Home
This home is located at 20401 N 3rd Dr Unit 1, Phoenix, AZ 85027 and is currently estimated at $257,300, approximately $258 per square foot. 20401 N 3rd Dr Unit 1 is a home located in Maricopa County with nearby schools including Esperanza Elementary School, Deer Valley Middle School, and Barry Goldwater High School.
Ownership History
Date
Name
Owned For
Owner Type
Purchase Details
Closed on
Dec 20, 2011
Sold by
Fannie Mae
Bought by
Beckham Cynthia
Current Estimated Value
Home Financials for this Owner
Home Financials are based on the most recent Mortgage that was taken out on this home.
Original Mortgage
$40,410
Outstanding Balance
$27,550
Interest Rate
3.94%
Mortgage Type
New Conventional
Estimated Equity
$229,750
Purchase Details
Closed on
Oct 7, 2011
Sold by
Wajand Nathan R
Bought by
Federal National Mortgage Association
Purchase Details
Closed on
Mar 13, 2007
Sold by
Long W D
Bought by
Wajand Nathan
Home Financials for this Owner
Home Financials are based on the most recent Mortgage that was taken out on this home.
Original Mortgage
$156,560
Interest Rate
6.31%
Mortgage Type
New Conventional
Purchase Details
Closed on
Nov 13, 2003
Sold by
Duncan Margaret
Bought by
Duncan Margaret Family Trust and Magic Investments Llc
Create a Home Valuation Report for This Property
The Home Valuation Report is an in-depth analysis detailing your home's value as well as a comparison with similar homes in the area
Home Values in the Area
Average Home Value in this Area
Purchase History
| Date | Buyer | Sale Price | Title Company |
|---|---|---|---|
| Beckham Cynthia | $44,900 | Stewart Title & Trust Of Pho | |
| Federal National Mortgage Association | $159,051 | None Available | |
| Wajand Nathan | $156,560 | Stewart Title & Trust Of Pho | |
| Duncan Margaret Family Trust | -- | -- |
Source: Public Records
Mortgage History
| Date | Status | Borrower | Loan Amount |
|---|---|---|---|
| Open | Beckham Cynthia | $40,410 | |
| Previous Owner | Wajand Nathan | $156,560 |
Source: Public Records
Tax History Compared to Growth
Tax History
| Year | Tax Paid | Tax Assessment Tax Assessment Total Assessment is a certain percentage of the fair market value that is determined by local assessors to be the total taxable value of land and additions on the property. | Land | Improvement |
|---|---|---|---|---|
| 2025 | $486 | $5,644 | -- | -- |
| 2024 | $478 | $5,375 | -- | -- |
| 2023 | $478 | $17,580 | $3,510 | $14,070 |
| 2022 | $460 | $13,680 | $2,730 | $10,950 |
| 2021 | $480 | $12,710 | $2,540 | $10,170 |
| 2020 | $471 | $11,070 | $2,210 | $8,860 |
| 2019 | $457 | $9,010 | $1,800 | $7,210 |
| 2018 | $441 | $7,770 | $1,550 | $6,220 |
| 2017 | $426 | $6,710 | $1,340 | $5,370 |
| 2016 | $402 | $6,300 | $1,260 | $5,040 |
| 2015 | $359 | $5,330 | $1,060 | $4,270 |
Source: Public Records
Map
Nearby Homes
- 521 W Hononegh Dr Unit 7
- 420 W Yukon Dr Unit 8
- 510 W Mohawk Ln
- 20813 N 9th Ave
- 20809 N 1st Ave
- 20256 N 10th Ave
- 209 W Behrend Dr
- 308 W Oraibi Dr
- 702 W Sequoia Dr
- 250 W Piute Ave
- 19820 N 13th Ave Unit 143
- 19820 N 13th Ave Unit 163
- 19820 N 13th Ave Unit 255
- 19820 N 13th Ave Unit 226
- 19819 N 3rd St
- 213 W Piute Ave
- 1480 W Montoya Ln
- 313 W Utopia Rd
- 1444 W Wickieup Ln
- 1425 W Sequoia Dr
- 20401 N 3rd Dr Unit 3
- 20401 N 3rd Dr Unit 4
- 20401 N 3rd Dr Unit 7
- 20401 N 3rd Dr Unit 8
- 20401 N 3rd Dr Unit 6
- 20401 N 3rd Dr Unit 2
- 20401 N 3rd Dr Unit 5
- 20401 N 3rd Dr
- 20421 N 3rd Dr Unit 7
- 20421 N 3rd Dr Unit 4
- 20421 N 3rd Dr Unit 8
- 20421 N 3rd Dr Unit 5
- 20421 N 3rd Dr Unit 1
- 20421 N 3rd Dr Unit 6
- 20421 N 3rd Dr Unit 3
- 20421 N 3rd Dr Unit 4
- 20421 N 3rd Dr
- 316 W Tonopah Dr Unit 7
- 316 W Tonopah Dr Unit 5
- 316 W Tonopah Dr Unit 6