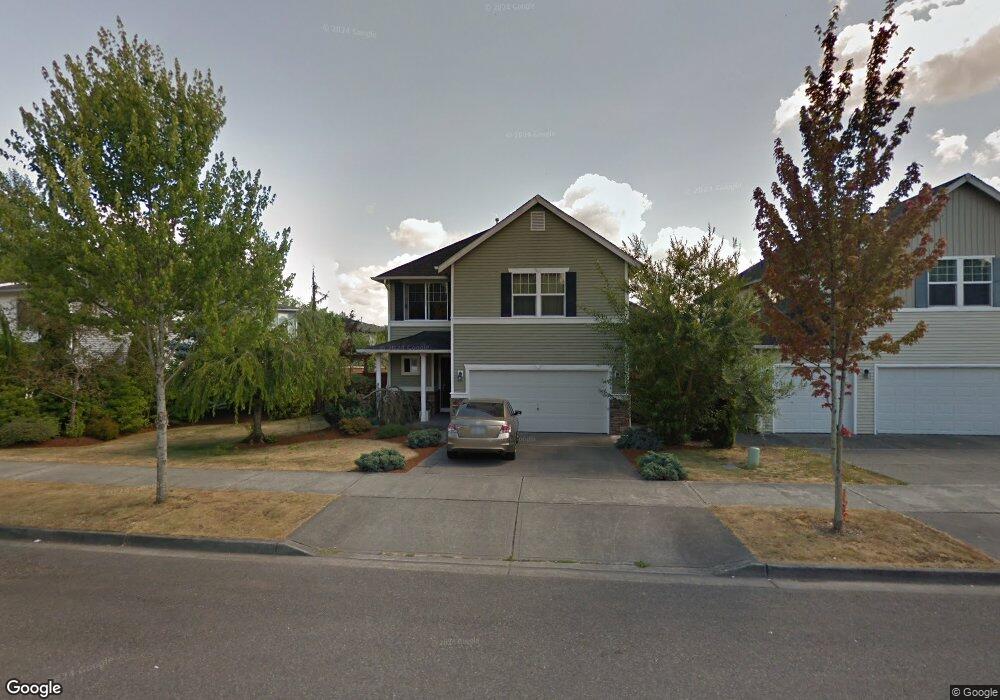
20406 Rustic View Rd SE Monroe, WA 98272
The Farm at Woods Creek NeighborhoodEstimated Value: $660,948 - $746,000
3
Beds
3
Baths
1,892
Sq Ft
$377/Sq Ft
Est. Value
About This Home
This home is located at 20406 Rustic View Rd SE, Monroe, WA 98272 and is currently estimated at $712,987, approximately $376 per square foot. 20406 Rustic View Rd SE is a home located in Snohomish County with nearby schools including Chain Lake Elementary School, Monroe High School, and Monroe Montessori School.
Ownership History
Date
Name
Owned For
Owner Type
Purchase Details
Closed on
Feb 16, 2012
Sold by
Federal Home Loan Mortgage Corporation
Bought by
Oltean Eduard D and Oltean Liliana G
Current Estimated Value
Home Financials for this Owner
Home Financials are based on the most recent Mortgage that was taken out on this home.
Original Mortgage
$219,387
Outstanding Balance
$147,187
Interest Rate
3.84%
Mortgage Type
New Conventional
Estimated Equity
$565,800
Purchase Details
Closed on
Oct 5, 2011
Sold by
Trim Amy L and Trim Jacob R
Bought by
Federal Home Loan Mortgage Corporation
Purchase Details
Closed on
May 13, 2005
Sold by
The Quadrant Corp
Bought by
Trim Jacob R and Trim Amy L
Home Financials for this Owner
Home Financials are based on the most recent Mortgage that was taken out on this home.
Original Mortgage
$218,719
Interest Rate
5.5%
Mortgage Type
Fannie Mae Freddie Mac
Create a Home Valuation Report for This Property
The Home Valuation Report is an in-depth analysis detailing your home's value as well as a comparison with similar homes in the area
Home Values in the Area
Average Home Value in this Area
Purchase History
| Date | Buyer | Sale Price | Title Company |
|---|---|---|---|
| Oltean Eduard D | -- | Northwest Title | |
| Federal Home Loan Mortgage Corporation | $196,991 | Northwest Title | |
| Trim Jacob R | $273,399 | Chicago |
Source: Public Records
Mortgage History
| Date | Status | Borrower | Loan Amount |
|---|---|---|---|
| Open | Oltean Eduard D | $219,387 | |
| Previous Owner | Trim Jacob R | $218,719 | |
| Closed | Trim Jacob R | $54,680 |
Source: Public Records
Tax History
| Year | Tax Paid | Tax Assessment Tax Assessment Total Assessment is a certain percentage of the fair market value that is determined by local assessors to be the total taxable value of land and additions on the property. | Land | Improvement |
|---|---|---|---|---|
| 2026 | $4,718 | $601,900 | $345,000 | $256,900 |
| 2025 | $4,508 | $581,300 | $307,000 | $274,300 |
| 2024 | $4,508 | $556,800 | $292,000 | $264,800 |
| 2023 | $4,423 | $592,700 | $322,000 | $270,700 |
| 2022 | $4,019 | $429,600 | $214,000 | $215,600 |
| 2020 | $3,676 | $378,700 | $189,000 | $189,700 |
| 2019 | $3,523 | $358,300 | $179,000 | $179,300 |
| 2018 | $3,823 | $318,600 | $149,000 | $169,600 |
| 2017 | $3,422 | $298,400 | $128,000 | $170,400 |
| 2016 | $3,343 | $268,300 | $105,000 | $163,300 |
| 2015 | $3,266 | $246,600 | $90,000 | $156,600 |
| 2013 | $2,792 | $192,800 | $77,000 | $115,800 |
Source: Public Records
Map
Nearby Homes
- 20290 Corbridge Rd SE
- 20620 137th St SE
- 20709 137th St SE
- 20726 Woods Creek Rd
- 13868 Chain Lake Rd
- 20148 135th Place SE
- 20114 135th Place SE
- 20153 135th Place SE
- 20129 135th Place SE
- 20145 135th Place SE
- 20117 135th Place SE
- 20041 135th Place SE
- 20035 135th Place SE
- 13493 200 Ave SE
- 13556 200 Ave SE
- 13477 200 Ave SE
- 13477 200th Ave SE
- 13453 200th Ave SE
- 13484 200 Ave SE
- 13476 200th Ave SE
- 20384 Rustic View Rd SE
- 20430 Rustic View Rd SE
- 20431 Springbrook Rd SE
- 20413 Springbrook Rd SE
- 20368 Rustic View Rd SE
- 20450 Rustic View Rd SE
- 20445 Springbrook Rd SE
- 20395 Springbrook Rd SE
- 20403 Rustic View Rd SE
- 20387 Rustic View Rd SE
- 20371 Rustic View Rd SE
- 20350 Rustic View Rd SE
- 20355 Rustic View Rd SE
- 20334 Rustic View Rd SE
- 20361 Springbrook Rd SE
- 20436 Springbrook Rd SE
- 20473 Rustic View Rd SE
- 20398 Springbrook Rd SE
- 20458 Springbrook Rd SE
- 20378 Springbrook Rd SE
Your Personal Tour Guide
Ask me questions while you tour the home.