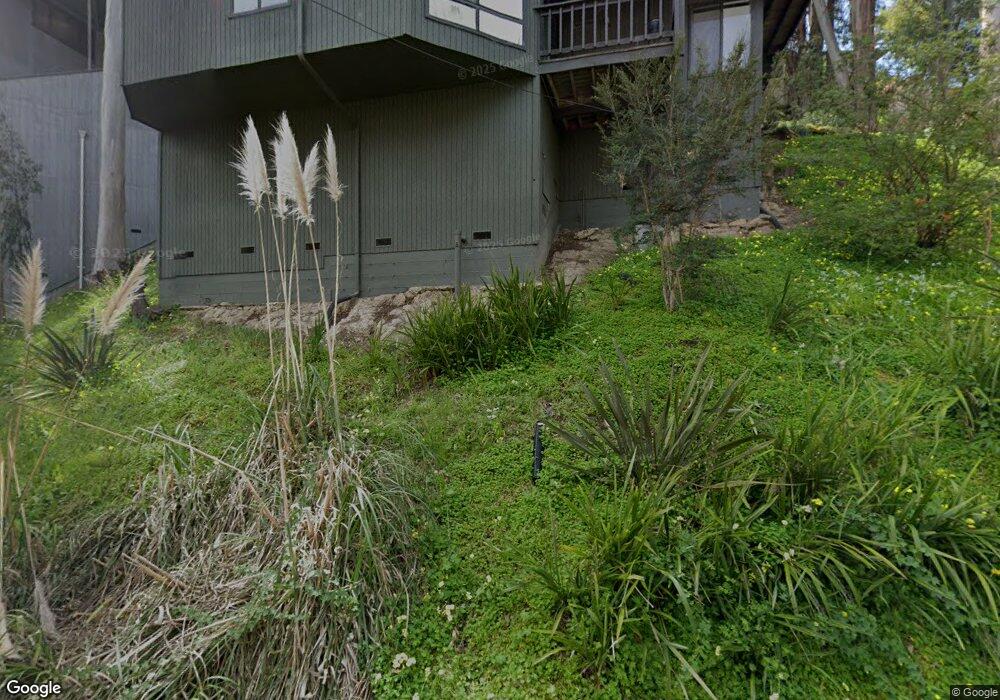
2041 Melvin Rd Oakland, CA 94602
Oakmore NeighborhoodEstimated Value: $1,161,000 - $1,294,466
3
Beds
3
Baths
1,776
Sq Ft
$692/Sq Ft
Est. Value
About This Home
This home is located at 2041 Melvin Rd, Oakland, CA 94602 and is currently estimated at $1,229,617, approximately $692 per square foot. 2041 Melvin Rd is a home located in Alameda County with nearby schools including Joaquin Miller Elementary School, Montera Middle School, and Skyline High School.
Ownership History
Date
Name
Owned For
Owner Type
Purchase Details
Closed on
Jun 3, 2015
Sold by
St John Roe Virginia and The Virginia St John Roe 2007
Bought by
Schou Family Trust
Current Estimated Value
Home Financials for this Owner
Home Financials are based on the most recent Mortgage that was taken out on this home.
Original Mortgage
$600,000
Outstanding Balance
$462,550
Interest Rate
3.62%
Mortgage Type
New Conventional
Estimated Equity
$767,067
Purchase Details
Closed on
Jun 20, 2007
Sold by
Bivolcic Delene and The Delene Bivolcic 2007 Revoc
Bought by
Roe Virginia St John and The Virginia St John Roe 2007
Purchase Details
Closed on
Mar 12, 1998
Sold by
Lee Kenneth Y and Lee Linda Y
Bought by
Roe Virginia Stjohn and Bivolcic Delene
Home Financials for this Owner
Home Financials are based on the most recent Mortgage that was taken out on this home.
Original Mortgage
$300,000
Interest Rate
7.11%
Create a Home Valuation Report for This Property
The Home Valuation Report is an in-depth analysis detailing your home's value as well as a comparison with similar homes in the area
Home Values in the Area
Average Home Value in this Area
Purchase History
| Date | Buyer | Sale Price | Title Company |
|---|---|---|---|
| Schou Family Trust | $750,000 | Placer Title Company | |
| Roe Virginia St John | $175,000 | None Available | |
| St John Roe Virginia | -- | None Available | |
| Roe Virginia Stjohn | $297,000 | Chicago Title Co | |
| Lee Linda Y | -- | Chicago Title Co |
Source: Public Records
Mortgage History
| Date | Status | Borrower | Loan Amount |
|---|---|---|---|
| Open | Schou Family Trust | $600,000 | |
| Previous Owner | Roe Virginia Stjohn | $300,000 |
Source: Public Records
Tax History Compared to Growth
Tax History
| Year | Tax Paid | Tax Assessment Tax Assessment Total Assessment is a certain percentage of the fair market value that is determined by local assessors to be the total taxable value of land and additions on the property. | Land | Improvement |
|---|---|---|---|---|
| 2025 | $12,979 | $894,357 | $270,407 | $630,950 |
| 2024 | $12,979 | $876,687 | $265,106 | $618,581 |
| 2023 | $13,665 | $866,361 | $259,908 | $606,453 |
| 2022 | $13,337 | $842,374 | $254,812 | $594,562 |
| 2021 | $12,829 | $825,724 | $249,817 | $582,907 |
| 2020 | $12,688 | $824,190 | $247,257 | $576,933 |
| 2019 | $12,259 | $808,034 | $242,410 | $565,624 |
| 2018 | $12,000 | $792,194 | $237,658 | $554,536 |
| 2017 | $11,559 | $776,661 | $232,998 | $543,663 |
| 2016 | $11,223 | $761,437 | $228,431 | $533,006 |
Source: Public Records
Map
Nearby Homes
- 4445 Arcadia Ave
- 2093 Braemar Rd
- 1842 Brentwood Rd
- 1975 Wrenn St
- 1942 Leimert Blvd
- 1989 Oakview Dr
- 4271 Whittle Ave
- 4751 Lincoln Ave
- 37 Coolidge Terrace
- 4081 Waterhouse Rd
- 180 Maiden Ln
- 2436 Potomac St
- 2471 Burlington St
- 5040 Pierpoint Ave
- 389 Somerset Rd
- 4019 Rhoda Ave
- 2818 Steinmetz Way
- 3073 Monterey Blvd
- 2039 Melvin Rd
- 20 Brentwood Place
- 2037 Melvin Rd
- 2038 Melvin Rd
- 16 Brentwood Place
- 2060 Melvin Rd
- 2020 Melvin Rd
- 2035 Melvin Rd
- 2082 Melvin Rd
- 23 Brentwood Place
- 2012 Melvin Rd
- 2 Brentwood Place
- 2033 Melvin Rd
- 4494 Arcadia Ave
- 2010 Melvin Rd
- 2098 Melvin Rd
- 19 Brentwood Place
- 2069 Braemar Rd
- 11 Brentwood Place
- 2037 Braemar Rd