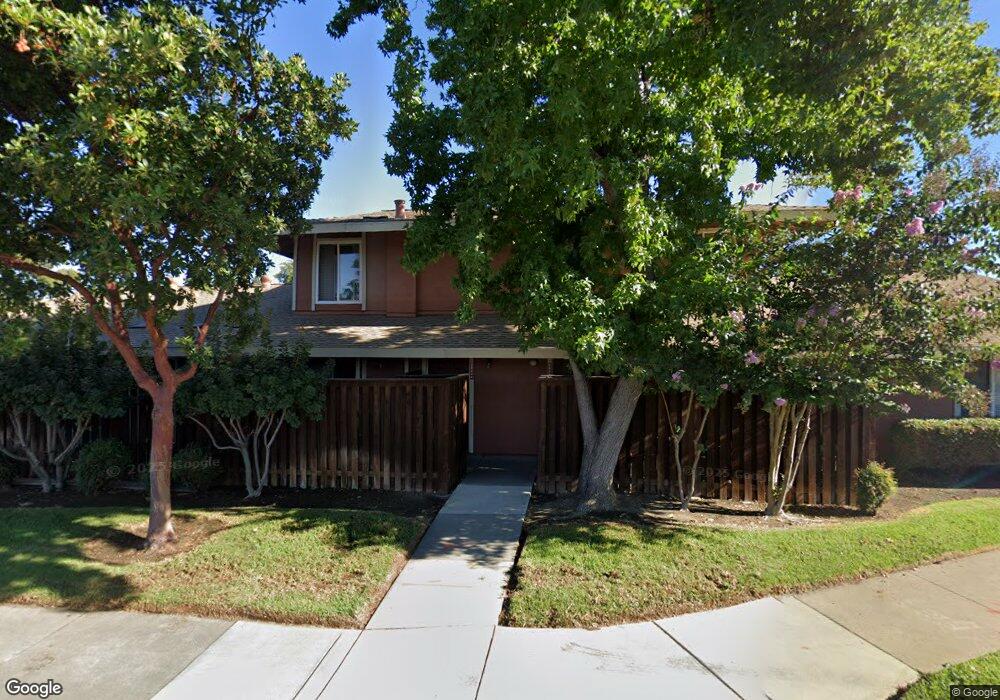
2041 Olivera Rd Unit C Concord, CA 94520
Buchanan Field NeighborhoodEstimated Value: $340,000 - $362,000
2
Beds
2
Baths
975
Sq Ft
$361/Sq Ft
Est. Value
About This Home
This home is located at 2041 Olivera Rd Unit C, Concord, CA 94520 and is currently estimated at $352,241, approximately $361 per square foot. 2041 Olivera Rd Unit C is a home located in Contra Costa County with nearby schools including Sun Terrace Elementary School, El Dorado Middle School, and Mt. Diablo High School.
Ownership History
Date
Name
Owned For
Owner Type
Purchase Details
Closed on
Jan 19, 2007
Sold by
Bradshaw Sheldon
Bought by
Johnson Bradshaw Carlisa R
Current Estimated Value
Purchase Details
Closed on
Oct 21, 2004
Sold by
Jegen Jene M
Bought by
Johnson Carlisa R
Home Financials for this Owner
Home Financials are based on the most recent Mortgage that was taken out on this home.
Original Mortgage
$168,000
Outstanding Balance
$80,963
Interest Rate
5.37%
Mortgage Type
Purchase Money Mortgage
Estimated Equity
$271,278
Purchase Details
Closed on
Feb 22, 2002
Sold by
Vaughan James Leslie and Vaughan Bebita V
Bought by
Jegen Jene M
Home Financials for this Owner
Home Financials are based on the most recent Mortgage that was taken out on this home.
Original Mortgage
$164,350
Interest Rate
6.8%
Mortgage Type
Purchase Money Mortgage
Create a Home Valuation Report for This Property
The Home Valuation Report is an in-depth analysis detailing your home's value as well as a comparison with similar homes in the area
Home Values in the Area
Average Home Value in this Area
Purchase History
We collect this data history from publicly available records. To have your information removed, we recommend requesting removal directly through your county’s website.
| Date | Buyer | Sale Price | Title Company |
|---|---|---|---|
| Johnson Bradshaw Carlisa R | -- | New Century Title Company | |
| Johnson Bradshaw Carlisa R | -- | New Century Title Company | |
| Johnson Carlisa R | $240,000 | Financial Title | |
| Jegen Jene M | $173,000 | Fidelity National Title Co |
Source: Public Records
Mortgage History
We collect this data history from publicly available records. To have your information removed, we recommend requesting removal directly through your county’s website.
| Date | Status | Borrower | Loan Amount |
|---|---|---|---|
| Open | Johnson Carlisa R | $168,000 | |
| Previous Owner | Jegen Jene M | $164,350 | |
| Closed | Johnson Carlisa R | $72,000 |
Source: Public Records
Tax History
| Year | Tax Paid | Tax Assessment Tax Assessment Total Assessment is a certain percentage of the fair market value that is determined by local assessors to be the total taxable value of land and additions on the property. | Land | Improvement |
|---|---|---|---|---|
| 2025 | $4,502 | $334,520 | $167,260 | $167,260 |
| 2024 | $4,391 | $327,962 | $163,981 | $163,981 |
| 2023 | $4,310 | $321,532 | $160,766 | $160,766 |
| 2022 | $4,271 | $315,228 | $157,614 | $157,614 |
| 2021 | $4,168 | $309,048 | $154,524 | $154,524 |
| 2019 | $4,050 | $299,884 | $149,942 | $149,942 |
| 2018 | $3,900 | $294,004 | $147,002 | $147,002 |
| 2017 | $3,322 | $248,000 | $124,000 | $124,000 |
| 2016 | $2,900 | $213,500 | $106,750 | $106,750 |
| 2015 | $2,494 | $177,500 | $88,750 | $88,750 |
| 2014 | $2,188 | $151,500 | $75,750 | $75,750 |
Source: Public Records
Map
Nearby Homes
- 2011 Olivera Rd Unit B
- 2067 Olivera Rd Unit B
- 2065 Olivera Rd Unit D
- 2069 Olivera Rd Unit E
- 1035 Peralta Rd Unit 16
- 2339 Dalis Dr Unit 193
- 1057 Peralta Rd Unit 26
- 2097 Dalis Dr Unit 79
- 2368 Dalis Dr
- 2322 Dalis Dr Unit 201
- 2159 Dalis Dr Unit 106
- 2868 Avon Ave
- 2848 Gillet Ave
- 2829 Hilltop Rd
- 2828 Hilltop Rd
- 3335 Northwood Dr Unit C
- 2037 Highland Dr
- 3715 Northwood Dr Unit G
- 2930 Knoll Dr
- 2102 Overhill Rd
- 2035 Olivera Rd Unit B
- 2035 Olivera Rd Unit A
- 2031 Olivera Rd
- 2031 Olivera Rd Unit B
- 2031 Olivera Rd Unit A
- 2031 Olivera Rd Unit D
- 2031 Olivera Rd Unit C
- 2043 Olivera Rd Unit D
- 2043 Olivera Rd Unit C
- 2043 Olivera Rd Unit B
- 2043 Olivera Rd Unit A
- 2041 Olivera Rd Unit D
- 2041 Olivera Rd Unit B
- 2041 Olivera Rd Unit A
- 2025 Olivera Rd Unit D
- 2025 Olivera Rd Unit D
- 2025 Olivera Rd Unit C
- 2025 Olivera Rd Unit B
- 2025 Olivera Rd Unit A
- 2021 Olivera Rd
Your Personal Tour Guide
Ask me questions while you tour the home.