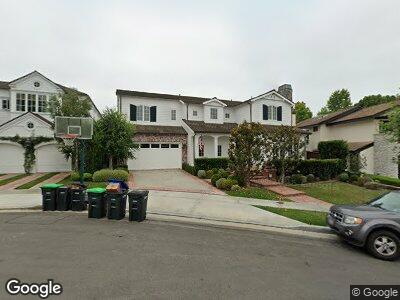
2041 Port Bristol Cir Newport Beach, CA 92660
Harbor View Homes NeighborhoodEstimated Value: $3,041,000 - $5,996,000
5
Beds
6
Baths
3,873
Sq Ft
$1,214/Sq Ft
Est. Value
About This Home
This home is located at 2041 Port Bristol Cir, Newport Beach, CA 92660 and is currently estimated at $4,701,765, approximately $1,213 per square foot. 2041 Port Bristol Cir is a home located in Orange County with nearby schools including Roy O. Andersen Elementary School, Corona del Mar Middle and High School, and Our Lady Queen Of Angels.
Ownership History
Date
Name
Owned For
Owner Type
Purchase Details
Closed on
Mar 26, 2003
Sold by
Turner John Brandel and Turner Kimberly Treece
Bought by
Turner John Brandel and Turner Kimberly Treece
Current Estimated Value
Purchase Details
Closed on
Feb 20, 2003
Sold by
Turner John B and Turner Kimberly T
Bought by
Turner John B and Turner Kimberly T
Home Financials for this Owner
Home Financials are based on the most recent Mortgage that was taken out on this home.
Original Mortgage
$552,500
Interest Rate
5.12%
Mortgage Type
Unknown
Purchase Details
Closed on
Apr 2, 1997
Sold by
Barry Gross and Barry Patricia Gross
Bought by
Turner John B and Turner Kimberly T
Home Financials for this Owner
Home Financials are based on the most recent Mortgage that was taken out on this home.
Original Mortgage
$421,600
Interest Rate
7.96%
Mortgage Type
Unknown
Create a Home Valuation Report for This Property
The Home Valuation Report is an in-depth analysis detailing your home's value as well as a comparison with similar homes in the area
Home Values in the Area
Average Home Value in this Area
Purchase History
| Date | Buyer | Sale Price | Title Company |
|---|---|---|---|
| Turner John Brandel | -- | -- | |
| Turner John Brandel | -- | -- | |
| Turner John B | -- | -- | |
| Turner John B | $527,000 | Lawyers Title Company |
Source: Public Records
Mortgage History
| Date | Status | Borrower | Loan Amount |
|---|---|---|---|
| Open | Turner John Brandel | $1,675,000 | |
| Closed | Turner John Brandel | $1,675,000 | |
| Closed | Turner John Brandel | $1,675,000 | |
| Closed | Turner John Brandel | $1,750,000 | |
| Closed | Turner John Brandel | $1,750,000 | |
| Closed | Turner John Brandel | $1,781,000 | |
| Closed | Turner John Brandel | $1,800,000 | |
| Closed | Turner John Brandell | $1,850,000 | |
| Closed | Turner John Brandel | $1,857,672 | |
| Closed | Turner John B | $1,900,000 | |
| Closed | Turner John B | $552,500 | |
| Closed | Turner John B | $554,000 | |
| Closed | Turner John B | $468,200 | |
| Closed | Turner John B | $474,000 | |
| Closed | Turner John B | $421,600 | |
| Closed | Turner John B | $52,700 |
Source: Public Records
Tax History Compared to Growth
Tax History
| Year | Tax Paid | Tax Assessment Tax Assessment Total Assessment is a certain percentage of the fair market value that is determined by local assessors to be the total taxable value of land and additions on the property. | Land | Improvement |
|---|---|---|---|---|
| 2024 | $18,471 | $1,725,075 | $651,625 | $1,073,450 |
| 2023 | $18,036 | $1,691,250 | $638,848 | $1,052,402 |
| 2022 | $17,734 | $1,658,089 | $626,322 | $1,031,767 |
| 2021 | $17,394 | $1,625,578 | $614,041 | $1,011,537 |
| 2020 | $17,226 | $1,608,910 | $607,745 | $1,001,165 |
| 2019 | $16,870 | $1,577,363 | $595,828 | $981,535 |
| 2018 | $16,533 | $1,546,435 | $584,145 | $962,290 |
| 2017 | $16,240 | $1,516,113 | $572,691 | $943,422 |
| 2016 | $15,874 | $1,486,386 | $561,462 | $924,924 |
| 2015 | $15,723 | $1,464,060 | $553,029 | $911,031 |
| 2014 | $15,352 | $1,435,382 | $542,196 | $893,186 |
Source: Public Records
Map
Nearby Homes
- 2007 Port Provence Place
- 1977 Port Cardiff Place
- 9 Saint Tropez
- 17 Monaco
- 31 Saint Tropez
- 1981 Port Dunleigh Cir
- 32 Bargemon
- 1730 Port Abbey Place
- 1991 Port Claridge Place
- 1736 Port Sheffield Place
- 15 Cavaillon
- 1954 Port Locksleigh Place
- 11 Montpellier Unit 22
- 1830 Port Wheeler Place
- 23 Lemans
- 27 Ferrand
- 1963 Port Edward Place
- 2023 Yacht Defender
- 2011 Yacht Vindex
- 2005 Yacht Resolute
- 2041 Port Bristol Cir
- 2037 Port Bristol Cir
- 2045 Port Bristol Cir
- 2048 Port Weybridge Place
- 2056 Port Weybridge Place
- 2042 Port Weybridge Place
- 2033 Port Bristol Cir
- 2049 Port Bristol Cir
- 2032 Port Bristol Cir
- 2036 Port Weybridge Place
- 2028 Port Bristol Cir
- 2083 Port Provence Place
- 2053 Port Bristol Cir
- 2029 Port Bristol Cir
- 2030 Port Weybridge Place
- 2024 Port Bristol Cir
- 2057 Port Bristol Cir
- 2045 Port Weybridge Place
- 2077 Port Provence Place
- 2039 Port Weybridge Place