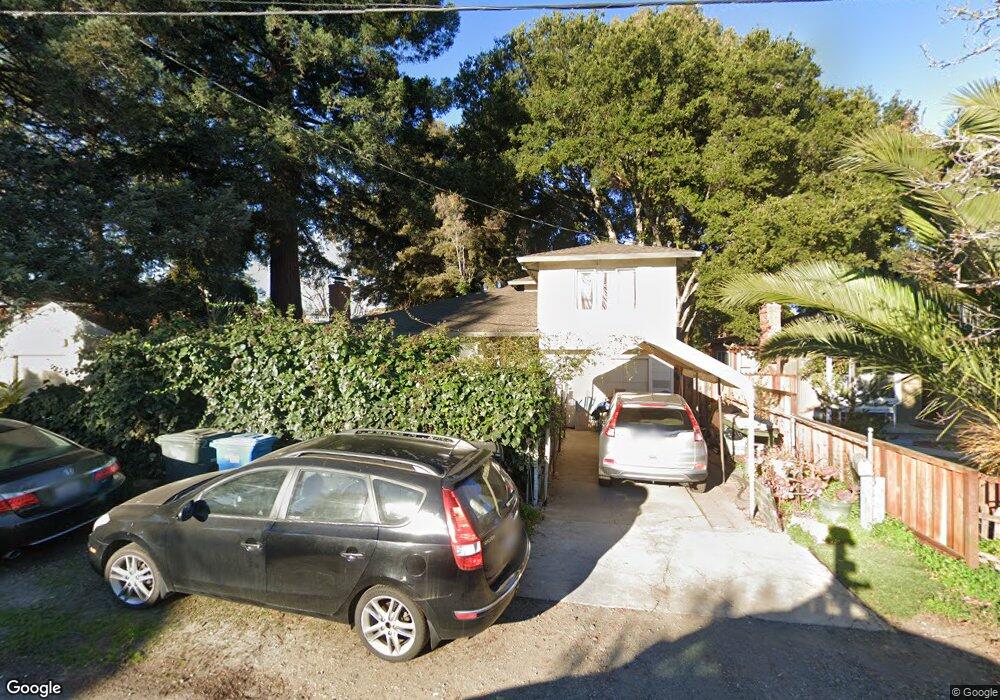
2041 Ralmar Ave East Palo Alto, CA 94303
Estimated Value: $1,192,000 - $2,323,000
3
Beds
2
Baths
1,900
Sq Ft
$844/Sq Ft
Est. Value
About This Home
This home is located at 2041 Ralmar Ave, East Palo Alto, CA 94303 and is currently estimated at $1,604,424, approximately $844 per square foot. 2041 Ralmar Ave is a home located in San Mateo County with nearby schools including Menlo-Atherton High School, KIPP Valiant Community Prep, and Silicon Valley International School - Willows Campus.
Ownership History
Date
Name
Owned For
Owner Type
Purchase Details
Closed on
Nov 10, 2020
Sold by
Smith Conniekay Palmer
Bought by
Conniekay Palmer Smith Trust and Smith
Current Estimated Value
Purchase Details
Closed on
Oct 20, 2020
Sold by
Palmer Conniekay
Bought by
Smith Conniekay Palmer
Purchase Details
Closed on
Oct 14, 1998
Sold by
Mckenna Patrick T and Mckenna Nancy B
Bought by
Smith James Ellis and Palmer Conniekay
Home Financials for this Owner
Home Financials are based on the most recent Mortgage that was taken out on this home.
Original Mortgage
$269,000
Interest Rate
6.37%
Create a Home Valuation Report for This Property
The Home Valuation Report is an in-depth analysis detailing your home's value as well as a comparison with similar homes in the area
Home Values in the Area
Average Home Value in this Area
Purchase History
| Date | Buyer | Sale Price | Title Company |
|---|---|---|---|
| Conniekay Palmer Smith Trust | -- | Smith Conniekay | |
| Smith Conniekay Palmer | -- | None Available | |
| Smith James Ellis | $299,000 | Old Republic Title Ins Compa |
Source: Public Records
Mortgage History
| Date | Status | Borrower | Loan Amount |
|---|---|---|---|
| Previous Owner | Smith James Ellis | $269,000 |
Source: Public Records
Tax History Compared to Growth
Tax History
| Year | Tax Paid | Tax Assessment Tax Assessment Total Assessment is a certain percentage of the fair market value that is determined by local assessors to be the total taxable value of land and additions on the property. | Land | Improvement |
|---|---|---|---|---|
| 2025 | $6,772 | $468,718 | $234,359 | $234,359 |
| 2023 | $6,772 | $450,518 | $225,259 | $225,259 |
| 2022 | $6,264 | $441,686 | $220,843 | $220,843 |
| 2021 | $6,131 | $433,026 | $216,513 | $216,513 |
| 2020 | $6,031 | $428,586 | $214,293 | $214,293 |
| 2019 | $6,044 | $420,184 | $210,092 | $210,092 |
| 2018 | $5,917 | $411,946 | $205,973 | $205,973 |
| 2017 | $5,712 | $403,870 | $201,935 | $201,935 |
| 2016 | $5,689 | $395,952 | $197,976 | $197,976 |
| 2015 | $5,614 | $390,006 | $195,003 | $195,003 |
| 2014 | $5,500 | $382,368 | $191,184 | $191,184 |
Source: Public Records
Map
Nearby Homes
- 165 E Okeefe St Unit 10
- 2118 Addison Ave
- 2112 Lincoln St
- 637 Central Ave
- 903 Laurel Ave
- 2273 Dumbarton Ave
- 315 Haight St
- 1024 Laurel Ave
- 212 Gilbert Ave
- 1908 Menalto Ave
- 2232 Euclid Ave
- 1049 Woodland Ave
- 2375 Palo Verde Ave
- 505 Runnymede St Unit C
- 1133 Jervis Ave
- 90 Crescent Dr
- 813 Bay Rd
- 811 Bay Rd
- 2396 Glen Way
- 1788 E Bayshore Rd