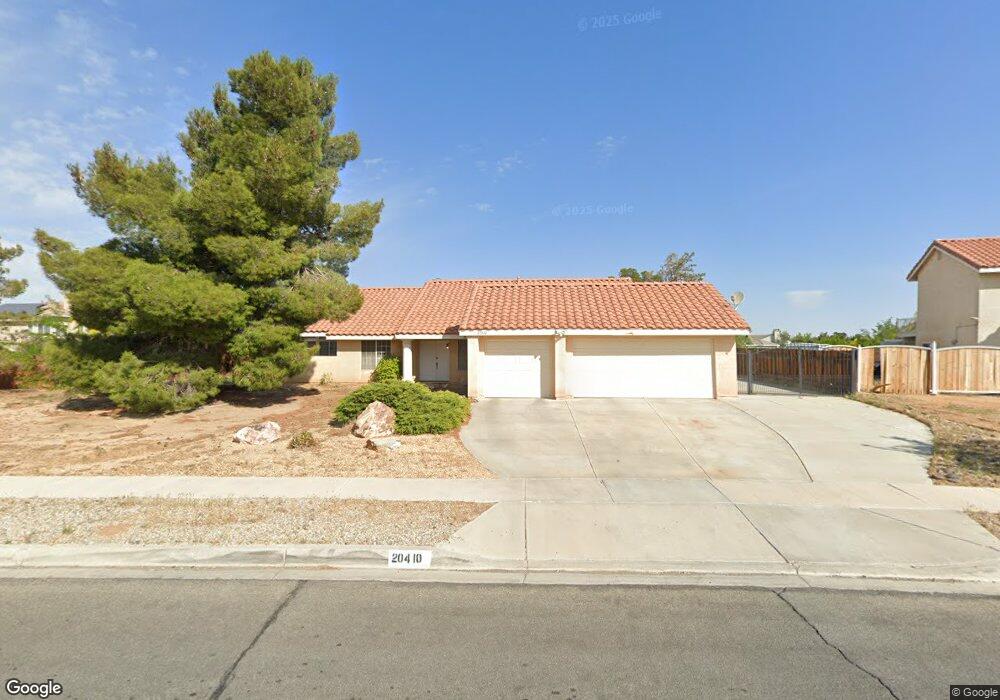
20410 Mockingbird Ave Apple Valley, CA 92308
High Desert NeighborhoodEstimated Value: $451,000 - $533,000
3
Beds
2
Baths
1,900
Sq Ft
$256/Sq Ft
Est. Value
About This Home
This home is located at 20410 Mockingbird Ave, Apple Valley, CA 92308 and is currently estimated at $486,539, approximately $256 per square foot. 20410 Mockingbird Ave is a home located in San Bernardino County with nearby schools including Sitting Bull Academy, Apple Valley High School, and Excelsior Charter School.
Ownership History
Date
Name
Owned For
Owner Type
Purchase Details
Closed on
Jun 19, 2008
Sold by
Morales Luis E
Bought by
Morales Luis E and Morales Linda M
Current Estimated Value
Purchase Details
Closed on
Mar 21, 2008
Sold by
Morales Luis E
Bought by
Morales Luis E and Morales Linda M
Purchase Details
Closed on
Aug 1, 2002
Sold by
Young Larry L
Bought by
Morales Luis E and Morales Linda M
Home Financials for this Owner
Home Financials are based on the most recent Mortgage that was taken out on this home.
Original Mortgage
$110,000
Interest Rate
6.37%
Purchase Details
Closed on
Sep 3, 1999
Sold by
Davis Young Larry L
Bought by
Davis Young Larry L and Davis Young Bonnie
Purchase Details
Closed on
Feb 4, 1998
Sold by
Washington Mutual Fa
Bought by
Young Larry L and Davis Young Bonnie
Home Financials for this Owner
Home Financials are based on the most recent Mortgage that was taken out on this home.
Original Mortgage
$61,500
Interest Rate
6.99%
Purchase Details
Closed on
Sep 22, 1997
Sold by
Berkefeld Robert E and Berkefeld Patricia M
Bought by
Great Western Bank
Create a Home Valuation Report for This Property
The Home Valuation Report is an in-depth analysis detailing your home's value as well as a comparison with similar homes in the area
Home Values in the Area
Average Home Value in this Area
Purchase History
| Date | Buyer | Sale Price | Title Company |
|---|---|---|---|
| Morales Luis E | -- | None Available | |
| Morales Luis E | -- | None Available | |
| Morales Luis E | -- | None Available | |
| Morales Luis E | -- | None Available | |
| Morales Luis E | $154,000 | First American Title | |
| Davis Young Larry L | -- | -- | |
| Young Larry L | $123,500 | Chicago Title Co | |
| Great Western Bank | $66,500 | Chicago Title Co |
Source: Public Records
Mortgage History
| Date | Status | Borrower | Loan Amount |
|---|---|---|---|
| Previous Owner | Morales Luis E | $110,000 | |
| Previous Owner | Young Larry L | $61,500 |
Source: Public Records
Tax History
| Year | Tax Paid | Tax Assessment Tax Assessment Total Assessment is a certain percentage of the fair market value that is determined by local assessors to be the total taxable value of land and additions on the property. | Land | Improvement |
|---|---|---|---|---|
| 2025 | $2,575 | $223,044 | $37,917 | $185,127 |
| 2024 | $2,501 | $218,671 | $37,174 | $181,497 |
| 2023 | $2,477 | $214,383 | $36,445 | $177,938 |
| 2022 | $2,438 | $210,179 | $35,730 | $174,449 |
| 2021 | $2,381 | $206,057 | $35,029 | $171,028 |
| 2020 | $2,351 | $203,944 | $34,670 | $169,274 |
| 2019 | $2,306 | $199,945 | $33,990 | $165,955 |
| 2018 | $2,248 | $196,025 | $33,324 | $162,701 |
| 2017 | $2,216 | $192,182 | $32,671 | $159,511 |
| 2016 | $2,119 | $188,413 | $32,030 | $156,383 |
| 2015 | $2,086 | $185,583 | $31,549 | $154,034 |
| 2014 | $1,707 | $150,700 | $29,900 | $120,800 |
Source: Public Records
Map
Nearby Homes
- 20365 Hohokam Rd
- 20404 Half Moon Ct
- 20592 Mockingbird Ave
- 12443 Bannock Dr
- 12563 Sarsi Ct
- 12574 Sarsi Ct
- 12655 Pocono Rd
- 11911 Kiowa Rd
- 19968 Bear Valley Rd
- 21100 Bear Valley Rd
- 11651 Anza Rd
- 11679 Winterhawk Way
- 20375 Wadena Terrace
- 21101 Sitkan Rd
- 0 Matawan Rd
- 19773 Bear Valley Rd
- 11550 Itoya Vista St
- 21215 Multnomah Rd
- 11591 Kiowa Rd
- 20726 Nisqually Rd
- 12220 Mockingbird Ave
- 12220 Mockingbird Place
- 12201 Sedona Rd
- 12209 Sedona Rd
- 12227 Pima Ct
- 20403 Mockingbird Ave
- 12242 Mockingbird Place
- 12217 Sedona Rd
- 20429 Mockingbird Ave
- 12237 Pima Ct
- 12264 Mockingbird Place
- 12237 Mockingbird Place
- 20457 Mockingbird Ave
- 12247 Pima Ct
- 20391 Hohokam Ct
- 12200 Sedona Rd
- 12274 Mockingbird Place
- 12263 Mockingbird Place
- 20399 Hohokam Ct
- 12216 Sedona Rd
Your Personal Tour Guide
Ask me questions while you tour the home.